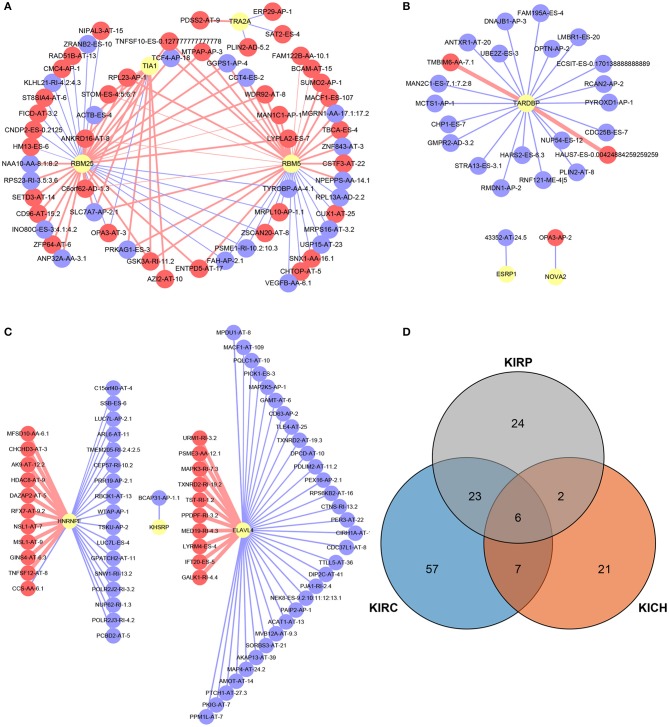
Figure 6.
SF-AS events regulatory network and the distribution of the key genes in PPI network. (A–C) The SF-AS events regulatory networks in KIRC, KICH, and KIRP, respectively. The red nodes represented the AS events that were positively related to survival. The purple nodes represented the AS events that were negatively related to survival. The red and purple lines represented a positive and negative correlation between the connected nodes, respectively. The larger the correlation coefficient was, the thicker the line was and vice versa. (D) The distribution of the key genes in PPI network. The orange, blue, and gray areas represent the genes in KIRC, KICH, and KIRP, respectively. The genes shown in overlapping regions exist in all relevant groups.

