Figure 1.
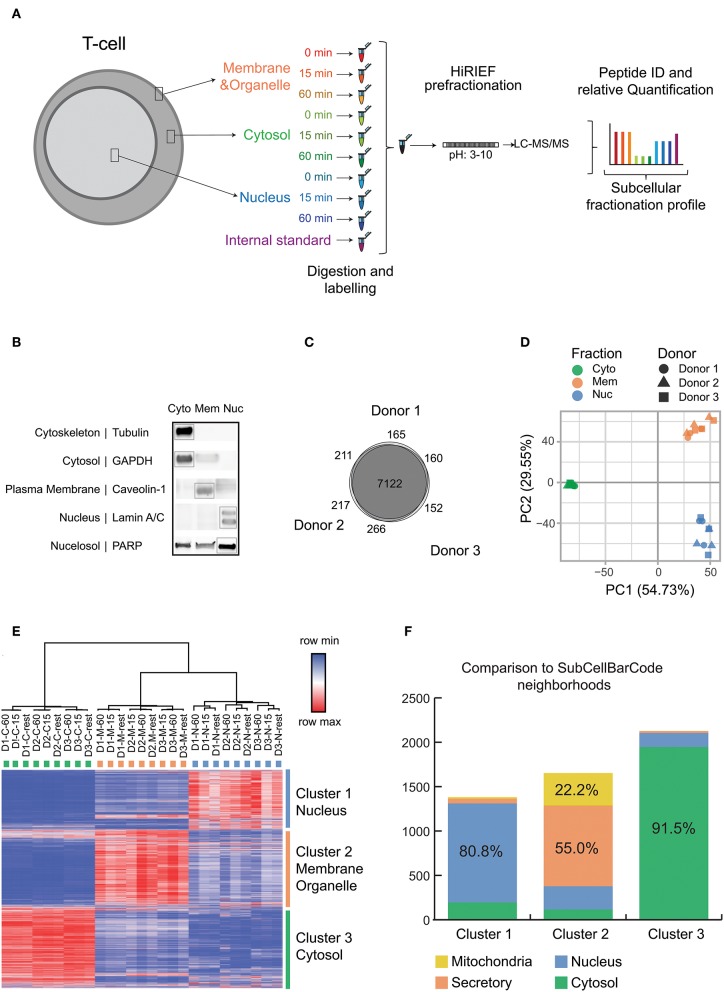
Experimental setup and quality control data for subcellular fractionation and LC-MS. (A) Overview of the subcellular fractionation and LC-MS workflow. CD4+ T cells were stimulated for 15 min or 1 h with cross linked anti-CD3/anti-CD28 antibodies (TCR stimulation) or processed as untreated. The cells upon fractionation were analyzed in MS as represented in the workflow. The subcellular fractions and time points of activation are represented by individual colors. The workflow was carried out individually for each donor/biological replicate (9 samples per donor) with the internal standard being the same pool of samples in all 3 runs/donors. (B) The figure is a representative immunoblot of the 3 subcellular components after fractionation probed with antibodies against markers of specific subcellular location as represented. (C) The total number of unique proteins (collapsed to gene ID) identified by at least 1 PSM for each donor and the overlap is depicted as Venn diagram. (D) Principle Component Analysis was performed on the TMT intensity ratios of individual components and time points from each donor normalized to the internal standard. The fractions are represented by individual colors and the donors are represented by individual shapes. (E) The heat map depicts log2 values of TMT intensity ratios and represented according to the indicated row normalized color scheme. The columns are clustered by average linkage method using 1 minus Pearson correlation. The rows are clustered by k means clustering (k = 3) by 1 minus Pearson correlation. The clusters are represented in individual colors. Proteins with full quantitation in all 3 donors were included (6,572 proteins). (F) The subcellular localization of proteins obtained are compared with localization from SubCellBarCode. Analysis is represented as stacked bar plot. The color scheme represents compartments as used in SubCellBarCode.

