Figure 2.
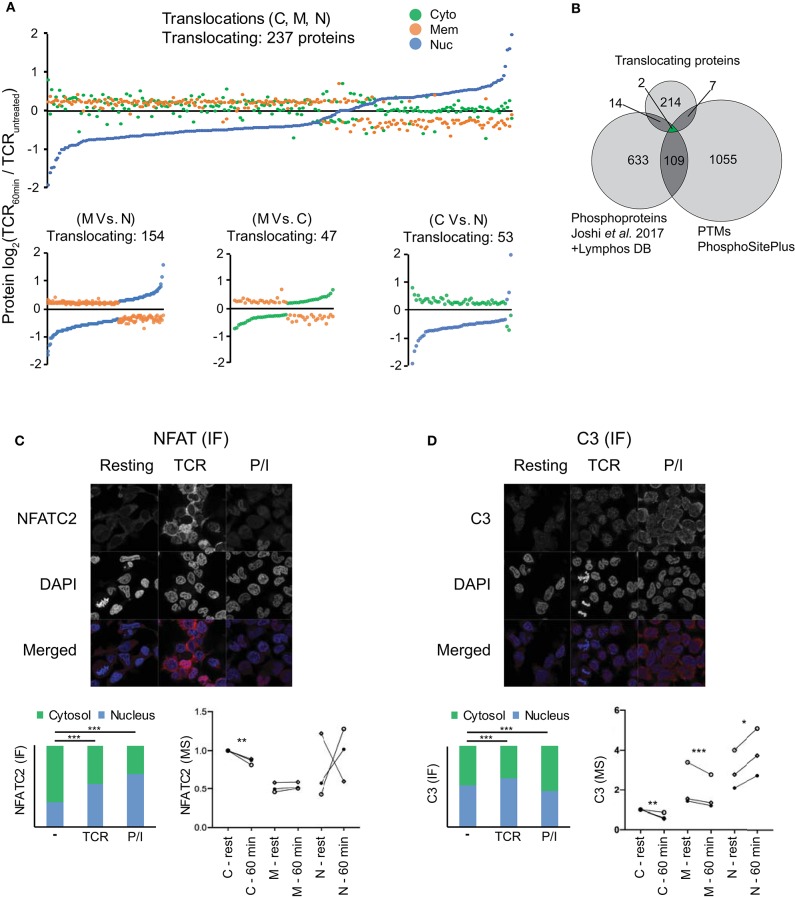
Subcellular translocation and microscopic validation of NFATC2 and C3 translocation. (A) Changes in the averaged log2 protein intensity in the cytosolic (C), membrane (M), and nuclear (N) compartment upon 1 h of TCR stimulation as compared to resting T cells are represented in the figure (P < 0.05, |log2FC|>0.201). Stimulation-induced shifts in all the 3 locations are presented in the top figure while individual comparisons are presented in each of the 3 figures on the bottom. (B) Venn diagram represents the overlap between the relocalized proteins, stimulation induced-phosphorylations and the PTMs regulating cellular location. Phosphoproteins were pooled from Joshi et al. (22) (changing over 25%) upon 5 min of TCR stimulation and from the LymPHOS database (changing over 50%) upon 15 min, 2 h or 4 h of PMA/Ionomycin stimulation. Additionally, PTMs experimentally reported to regulate intracellular localization from PhosphoSitePlus were used for also comparison. (C,D) Representative microscopic images for IF staining for NFATC2 (C) and complement component C3 (D) from Jurkat T cells in various conditions are presented along with averaged values (median) in form of stacked bar graphs (lower left) (total IF staining signal set to 1). Stacked bar graphs represent stimulation-induced redistribution of molecules between nuclear and cytoplasmic compartment, from an average of >100 cells each. P-values are calculated by Mann Whitney test and are indicated by stars with: *P < 0.05, **P < 0.01, ***P < 0.001. Nuclear marker DAPI in blue and target proteins in red. Additionally, MS results for subcellular relocalization upon 1 h of TCR stimulation for corresponding proteins are also presented (lower right). Donors are represented by individual symbols and the values are normalized to cytosolic protein intensity at resting stage which was further set to 1. P values calculated by the DeqMS R-package are indicated by stars with: *p < 0.05, **p < 0.01, ****p < 0.001.

