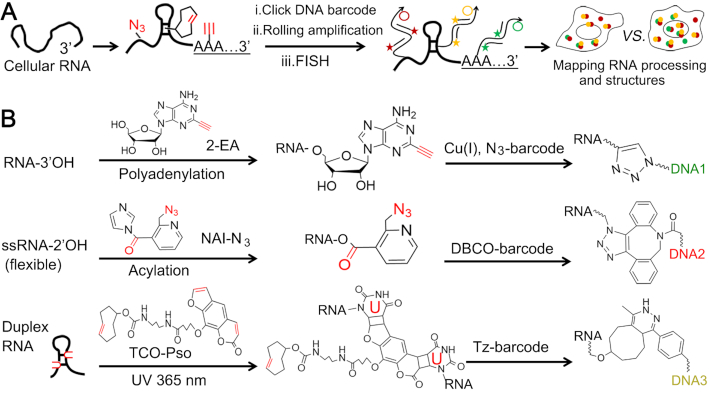
Figure 1.
Overview of ClickerFISH visualizing RNA processing and structures. (A) The workflow for visualizing RNA polyadenylation and single-stranded/duplex regions. (B) The detailed chemical reactions are illustrated, respectively. DNA1, DNA2 and DNA3 indicate the clickable DNA barcodes initiating rolling amplification.

