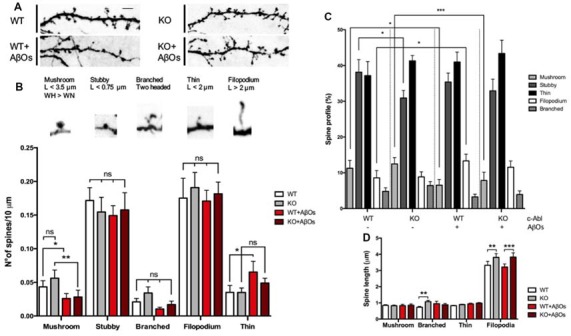
Figure 3.

c-Abl modulates dendritic spine morphology: c-Abl deficiency increased formation of immature spines after Aβ oligomers treatment. (A) Dendrite sections of WT and c-Abl-KO neurons treated with AβOs present morphological variations on dendritic spines. Scale bar = 2 μm. Dendritic spines were classified into five categories: mushroom when the head (H) is wider (W) than the width of the neck (WN); stubby for neckless protrusions less than 0.75 μm length (L); thin for protrusions shorter than 2 μm; filopodium for protrusions longer than 2 μm. Finally, two-headed spines were classified as branched. (B) Analysis of spines suggests their distribution per 10 μm dendrite. Control WT and c-Abl-KO neurons have significantly more mushroom than treated neurons (WT: 0.04 ± 0.01 vs. KO: 0.06 ± 0.01 spines/10 μm dendrite), slightly decreased stubby (WT: 0.17 ± 0.02 vs. KO: 0.15 ± 0.02 spines/10 μm dendrite), slightly increased thin (WT: 0.18 ± 0.03 vs. KO: 0.19 ± 0.02 spines/10 μm dendrite) and filopodium (WT: 0.04 ± 0.01 vs. KO: 0.04 ± 0.01 spines/10 μm dendrite) and slightly increased branched spines per dendrite (WT: 0.02 ± 0.01 vs. KO: 0.03 ± 0.01 spines/10 μm dendrite). After AβOs treatment, both, WT and c-Abl-KO neurons showed a significant reduction in the density of mushroom (WT: 0.03 ± 0.01 and KO: 0.03 ± 0.01 spines/10 μm dendrite) and stubby spines (WT: 0.15 ± 0.01 and KO: 0.16 ± 0.03 spines/10 μm). After AβOs treatment WT neurons presented higher density of filopodia spines than c-Abl-KO neurons (0.07 ± 0.02 vs. 0.05 ± 0.01 spines/10 μm dendrite, respectively) and maintenance of thin spines (0.17 ± 0.02 vs. 0.18 ± 0.02 spines/10 μm dendrite). Branched spines showed no changes after AβOs treatment (WT: 0.01 ± 0.002 vs. KO: 0.02 ± 0.01 spines/10 μm dendrite). (C) Spine type relative profile [percentage of each spine type classified in (B) counting 2–5 dendrites per neuron]. In WT and c-Abl-KO neurons, the population of thin spines increases (WT: 37.2 ± 2.8% n = 14 neurons; KO: 41.3 ± 1.5% n = 15 neurons; WT+AβOs: 41 ± 3.9% n = 13 neurons; KO+AβOs: 43.4 ± 1.7%, n = 18 neurons) and mushroom spines decreases after AβOs treatment (WT: 11.3 ± 2.2%; KO: 12.5 ± 1.8%; WT+AβOs: 6.6 ± 1.6%; KO+AβOs: 7.9 ± 2.3%); while filopodia spines increased (WT: 8.6 ± 2%; KO: 8.9 ± 1.4%; WT+AβOs: 13.3 ± 1.9%; KO+AβOs: 11.6 ± 1.9%); Stubby (WT: 38.1 ± 3.5%; KO: 30.9 ± 2.1%; WT+AβOs: 35.4 ± 2.5%; KO+AβOs: 32.9 ± 3.3%); and branched (WT: 4.8 ± 1.0%; KO: 6.5 ± 1.1%; WT+AβOs: 3.3 ± 0.8%; KO+AβOs: 3.9 ± 1.0%). (D) The graph shows spine length for mushroom, branched, thin and filopodia spines. AβOs induced longer filopodia spines (WT+AβOs: 3.22 ± 0.19 μm, KO: 3.83 ± 0.26 μm). Two-way ANOVA, ***p < 0.001. n = 3 independent cultures, 4–5 mice embryos per condition. non-significant: ns; *p < 0.5; **p < 0.01.
