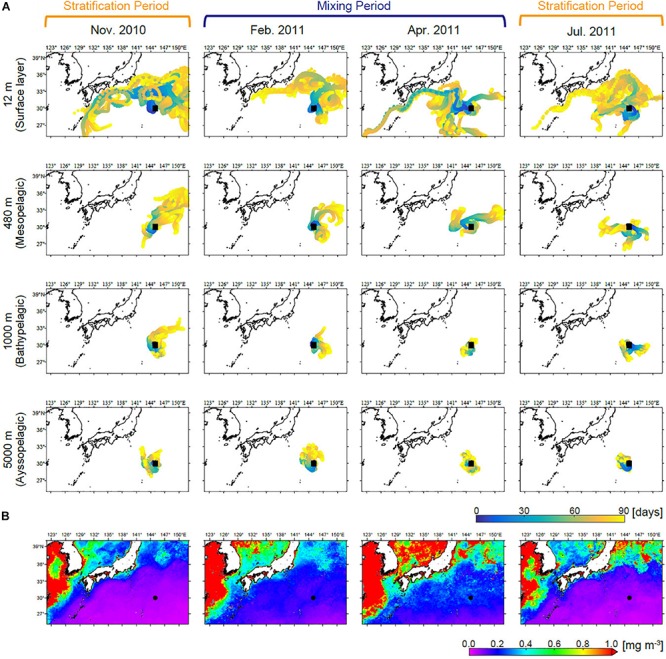
FIGURE 2.

(A) Back trajectories of particles present at station S1 at depths of the 12 (surface layer), 480 (mesopelagic zone), 1,000 (bathypelagic zone), and 5,000 m (abyssopelagic zone) over the 90 days prior to sampling each month. Back trajectories at the other depths are shown in Supplementary Figure S3. (B) Satellite-derived (MODIS Aqua) chl a averaged over the 90 days prior to sampling each month.
