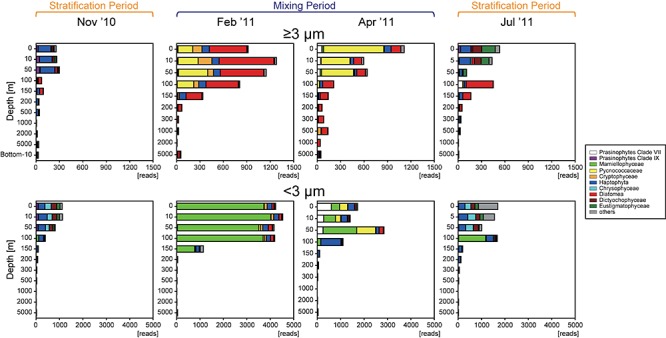
FIGURE 3.

Vertical distributions of the total number of eukaryotic phytoplankton sequences in each fraction during each season. Major groups are shown in color and listed in the legend.

Vertical distributions of the total number of eukaryotic phytoplankton sequences in each fraction during each season. Major groups are shown in color and listed in the legend.