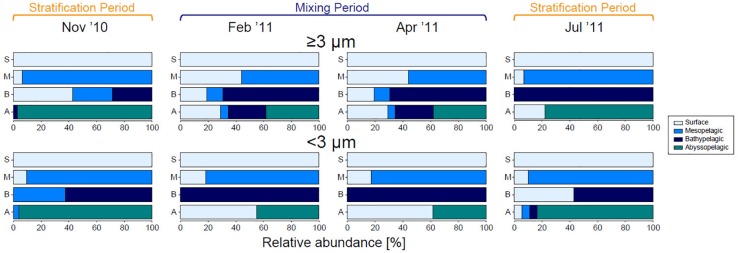
FIGURE 8.
Contribution of eukaryotic phytoplankton sequence reads originating in each layer/zone, for each size fraction during each month. SVs observed in the surface layer were set to 100%, shown by the first bar (light blue), and ratios of that value to total reads in deeper zones are shown below. SVs that were first detected in the mesopelagic, bathypelagic, and abyssopelagic zones are indicated by blue, dark blue, and green bars, respectively.

