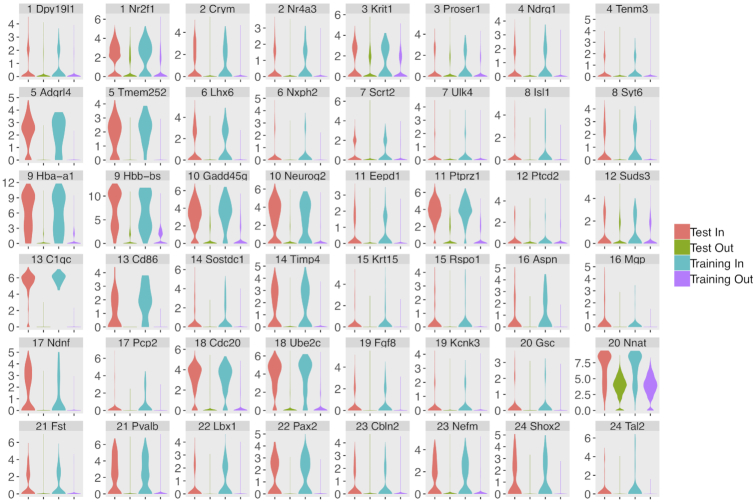
Figure 6.
LCA analysis of a large combined dataset including 1.3 million embryonic day 18 murine brain cells collected on Chromium Single Cell 3′ v2 kits (10× Genomics, Pleasanton, CA), and ∼5500 embryonic day 17 murine cerebellum cells collected on the GemCode platform (the Carter E17 dataset). Expression profiles of marker genes were shown in violin plot for each individual cluster.

