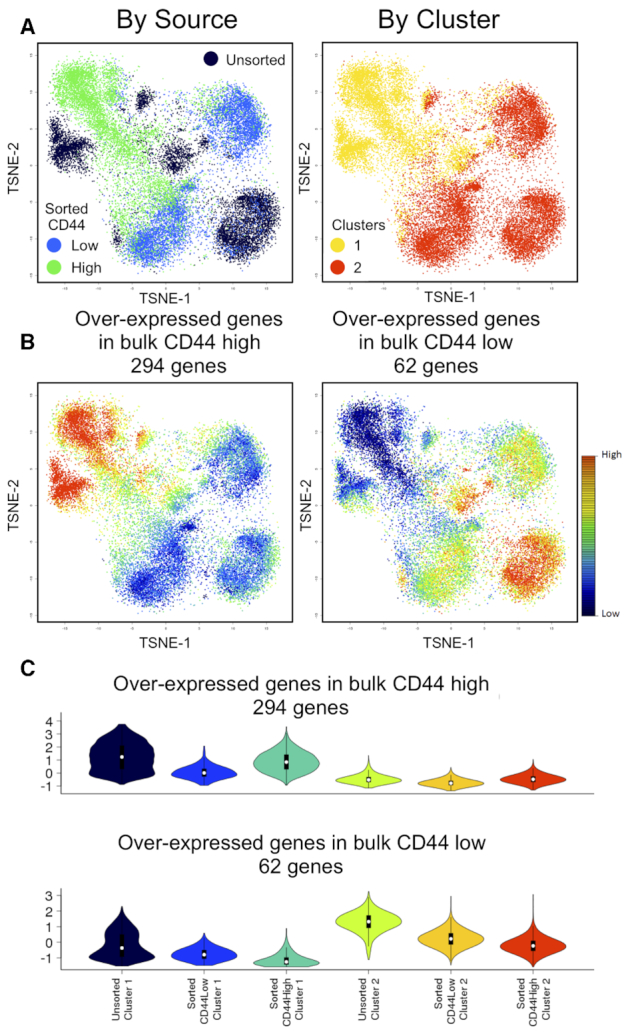
Figure 8.

LCA analysis of Rh41 cells, correcting for batch effects. (A) t-SNE plots of clustering results, colored according to source ID or cluster ID. (B) Cellular expression patterns of DEGs identified in bulk RNA-seq. (C) Violin plot of expression patterns of DEGs from bulk RNA-seq in cells classified by source and cluster ID.
