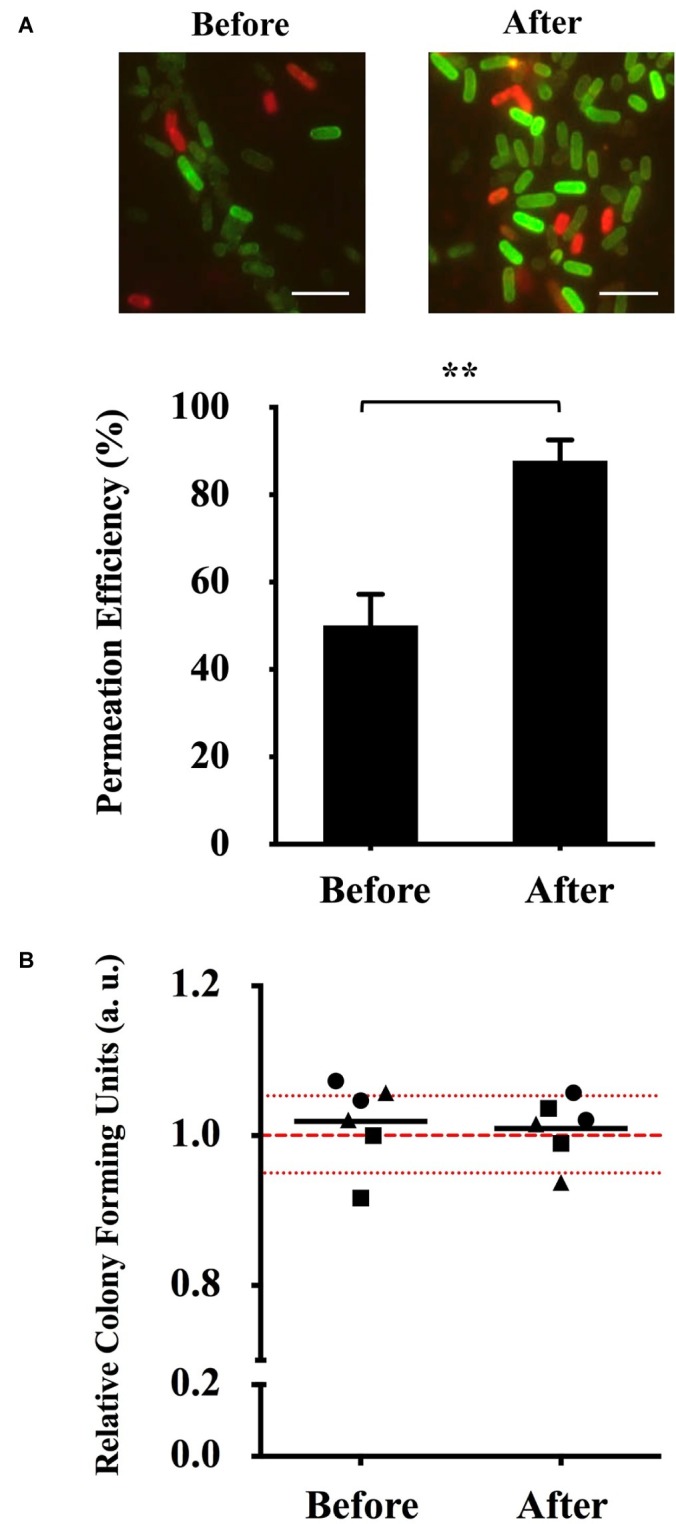
Figure 3.

Optimization of (KFF)3K-FAM permeation and survival rate determination. (A) Fluorescence microscopic image (top) and permeation efficiency (bottom) of E. coli treated with (KFF)3K-FAM before (2 μM, RT, 1 h) and after (2 μM, 37°C, 1 h) optimization. Images of (KFF)3K-FAM permeated cells were captured at similar exposure times to allow for comparison. Scale bar is 5 μm. Statistical significance (p < 0.05) was determined by t-test with a p of 0.0016. (B) Relative colony forming units (CFUs) of (KFF)3K-FAM permeated cells sorted as single cells using flow cytometry before and after optimization. A total number of 240 cells/plate in doublets were sorted from three trials (● Trial 1, ■ Trial 2, ▲ Trial 3) and the relative average is indicated as the dark lines. All samples were treated with Trypan Blue prior to sorting. Non-(KFF)3K-FAM treated cells were sorted as the positive control and the average is represented as the red dotted line. The red spotted lines above and below the red dotted line represent the relative number of CFUs within the 5% range from the average.
