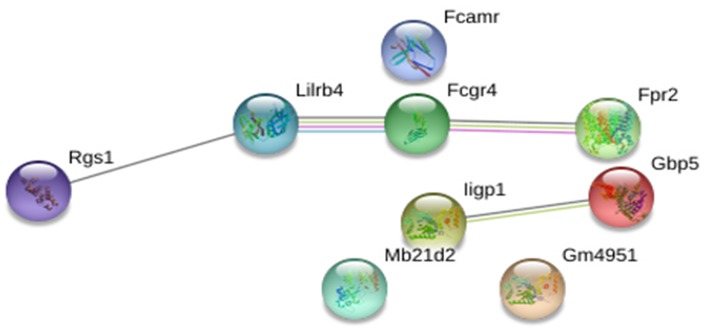
Figure 5.
STRING analysis of the 10 DEGs that were significantly up-regulated (p < 0.05, fold change>2) in non-vaccinated (PBS) mice at early chronic phase of VL. STRING analysis achieved a PPI network of 9 nodes and 4 edges, with PPI enrichment p = 0.000267. Lines in different color represent 7 types of evidence used in predicting associations. Red line: fusion evidence; green line: neighborhood evidence; blue line: co-occurrence evidence; purple line: experimental evidence; yellow line: text mining evidence; light blue line: database evidence and black line: co-expression evidence.

