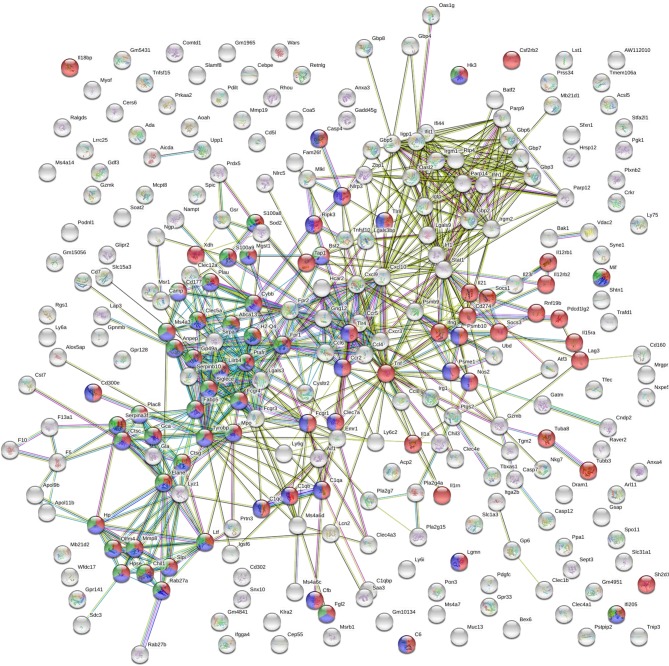
Figure 7.
STRING analysis of the DEGs that were significantly up-regulated (p < 0.05, fold change > 2) in both vaccinated (p8-CPA160−189) and non-vaccinated (PBS) mice at late chronic phase of VL. STRING analysis achieved a PPI network of 271 nodes and 729 edges, with PPI enrichment p < 1.0e−16. Red shows genes involved in “immune system” term, blue shows genes involved in “innate immune responses” term and green show genes involved in “neutrophil infiltration” term. Lines in different color represent 7 types of evidence used in predicting associations. Red line: fusion evidence; green line: neighborhood evidence; blue line: co-occurrence evidence; purple line: experimental evidence; yellow line: text mining evidence; light blue line: database evidence and black line: co-expression evidence.

