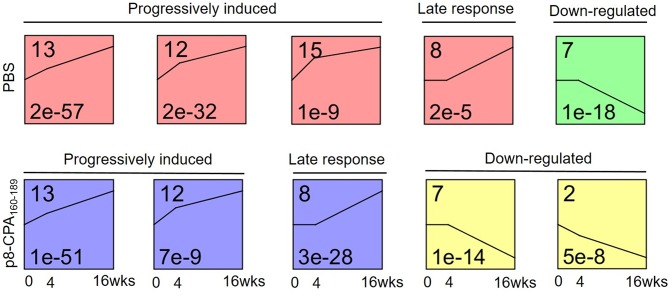
Figure 8.
Microarray time course analysis of DEGs. STEM analysis classified 629 DEGs of spleens from non-vaccinated (PBS) and vaccinated (p8-CPA160−189) mouse groups at 0 (non-vaccinated non-infected), 4 and 16 weeks into 6 significant patterns of gene expression (p < 0.05). DEGs were classified into five main possible profiles according to the temporal gene expression pattern. Each square represents a pattern of gene cluster obtained by the STEM software. The number at the upper left corner of the box represents the profile ID number, and the black broken line in the box represents the overall trend in the expression of all genes in the gene set. The number in the lower left corner indicates the p-value assessing the similarity of the gene expression in the cluster.

