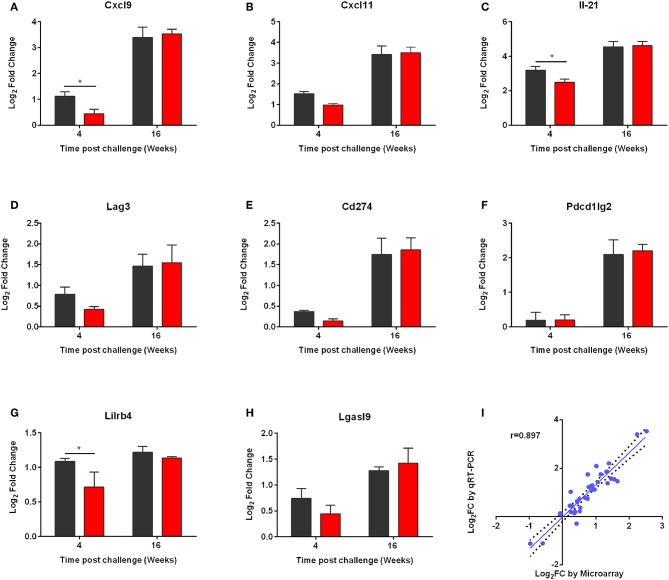
Figure 9.
qRT-PCR validation of the microarray data. (A) CXCL9, (B) CXCL11, (C) IL-21, (D) LAG3, (E) CD274, (F) PD-L2, (G) LILRB4, and (H) LGASL9 were validated. qPCR analysis for the expressions of the above genes was conducted in the RNA samples of non-vaccinated (PBS; black) and vaccinated (p8-CPA160−189; red) mice at 4 and 16 weeks post challenge. The data are displayed as Log2 fold-change relative to the expression in naïve (non-vaccinated non-infected) mice. Results are presented as means ± SD of three individual mice per group. (I) Correlation between microarray and qRT-PCR expression data for 9 selected genes at 4 and 16 weeks post challenge both in vaccinated and non-vaccinated mice. Correlation between microarray and qRT-PCR data was analyzed by Spearman's Rho test. The correlation coefficient was = 0.897, with a statistical significance of p < 0.001.

