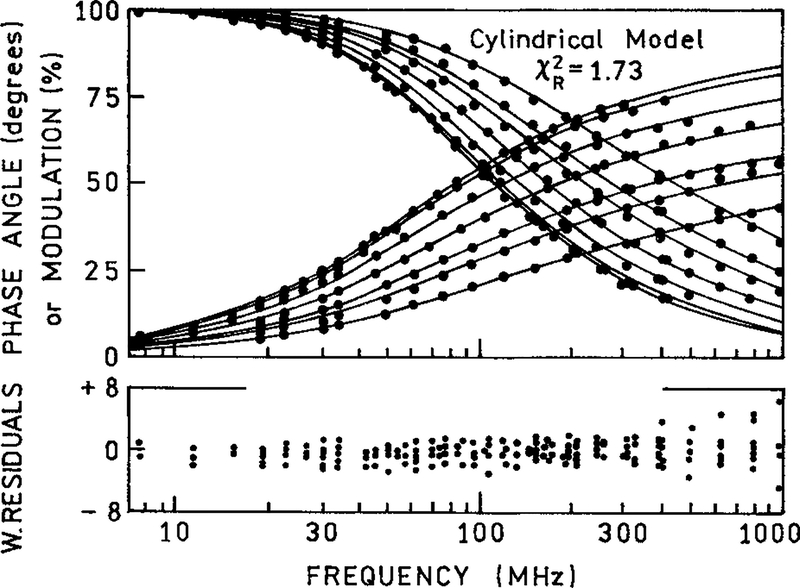
Figure 6.
The frequency-domain phase and modulations of DNA-bound Ho in the absence and presence of PI with various concentrations (2, 10, 20, 30, 40, and 50 μM). The frequency-domain intensity decays were analyzed using the cylindrical model [eqs. (1) and (11)] and fitting the (—) acceptor concentrations. In the analysis we used a Förster distance of 35.7 Å and a cylinder radius of 4 Å. The lower panel shows weighted residuals for phase and modulation [see eq. (20)].

