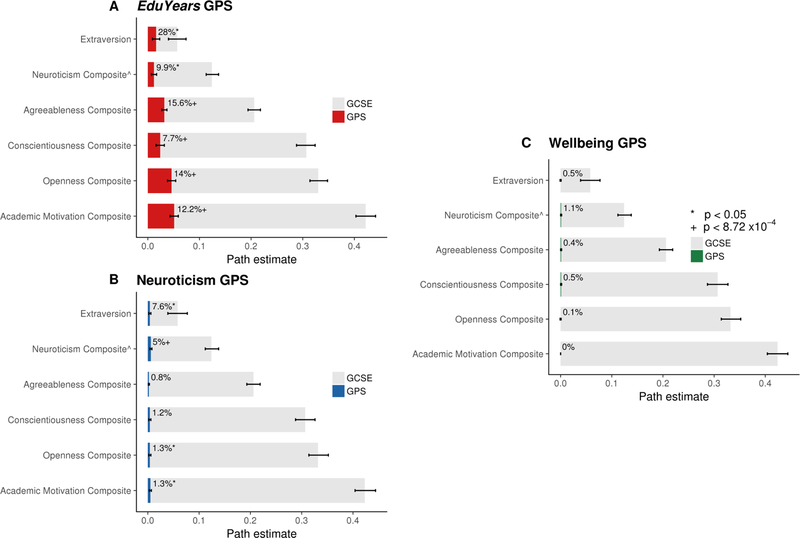
Figure 3.
Standardized path estimates for the association between GCSE (General Certificate of Secondary Education) grades and personality/motivation domains, and the proportion of these associations accounted for by (A) EduYears GPS (genome-wide polygenic scores) (B) Neuroticism GPS and (C) Wellbeing GPS. Error bars represent robust standard errors. Path estimates presented are estimated based on maximum likelihood (see Table 4 for all path estimates). ‘^’ = the direction of association between the Neuroticism composite and GCSE grades was negative; ‘+’ = p-value threshold for significance after correction for multiple testing (8.72 × 10⁻⁴).

