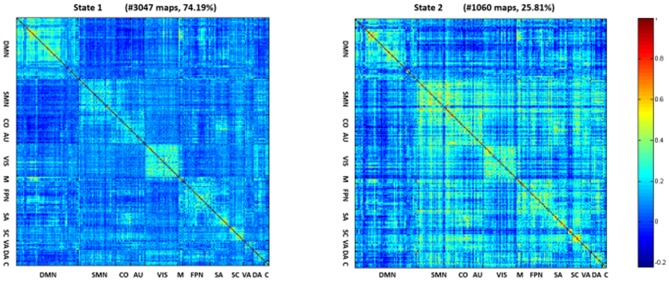
Figure 2.
Centroids of the two dFNC states. In state 1, the whole network displayed slight negative connectivity and slight positive connectivity intra-networks. State 2 showed moderate positive connectivity within and between most inter-networks, while the connectivity was negative between DMN and others.

