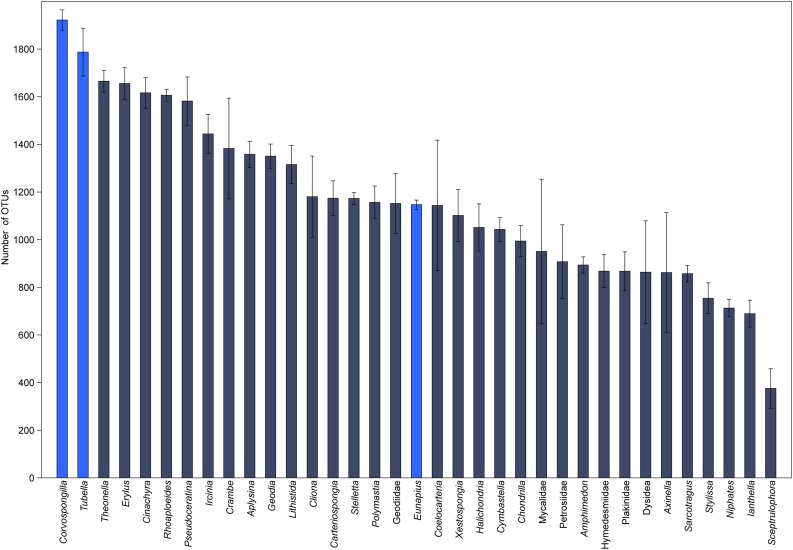
FIGURE 3.
Global richness comparison of the microbial community of T. variabilis with two freshwater sponges and 32 marine sponges. The bars represent the average number of OTUs (n = 3 or 2 per sponge) with the standard deviation. Bright blue bars are freshwater sponges and in dark blue bars are marine sponges.

