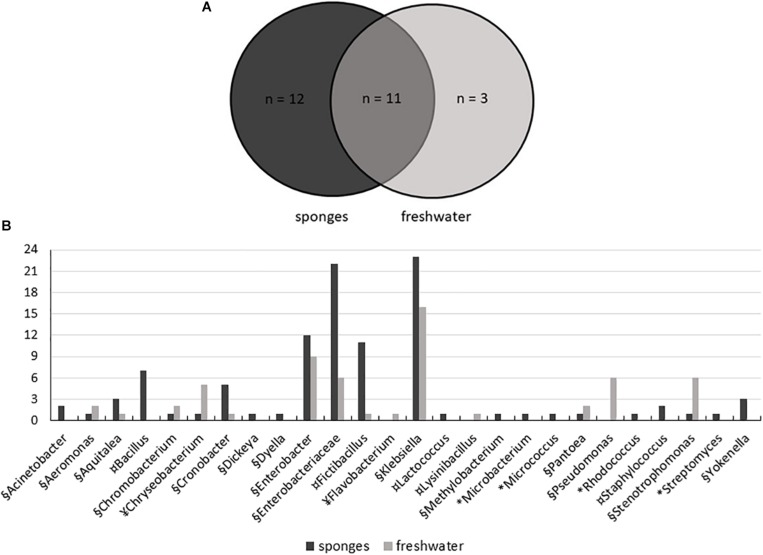
FIGURE 5.
Distribution of bacteria isolated from T. variabilis and surrounding freshwater samples. (A) Venn diagram shows the numbers of common and unique bacterial strains isolated from sponges and from freshwater. (B) Phylogenetic composition of the bacteria culturable community from the T. variabilis and freshwater samples. Stacked column bar graph depicting the absolute abundances of bacterial genera and family isolated. Bacterial isolates belonging to Actinobacteria (∗), Bacteroidetes (¥), Firmicutes (¤), and Proteobacteria (§) are indicated.

