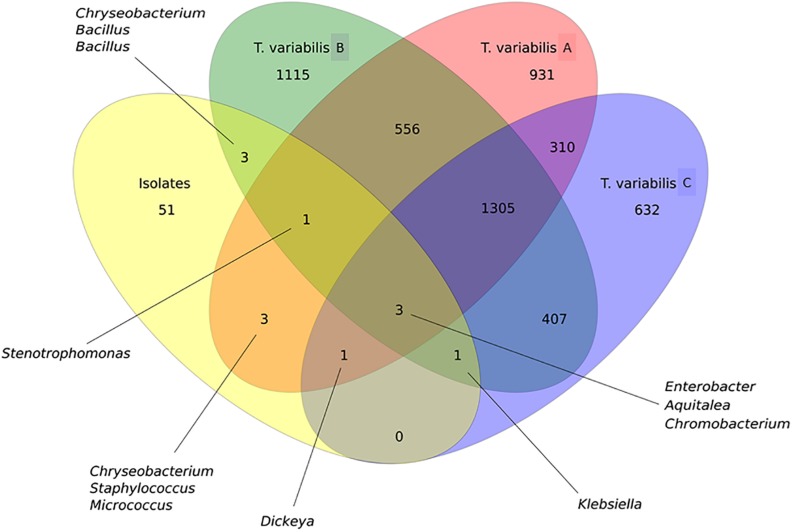
FIGURE 6.
Venn diagram that illustrates the relationship between OTUs that were detected in the T. variabilis samples by culture-independent and culture-dependent analysis. A comparison of the overlap in terms OTUs in the three different sponge samples (T. variabilis A, B, and C) and their cultivable fractions (isolates). The numbers of OTUs from and shared by each sample are represented inside the oval shapes and the main bacterial genera are indicated. Venn diagram of OTUs at distance 0.03.

