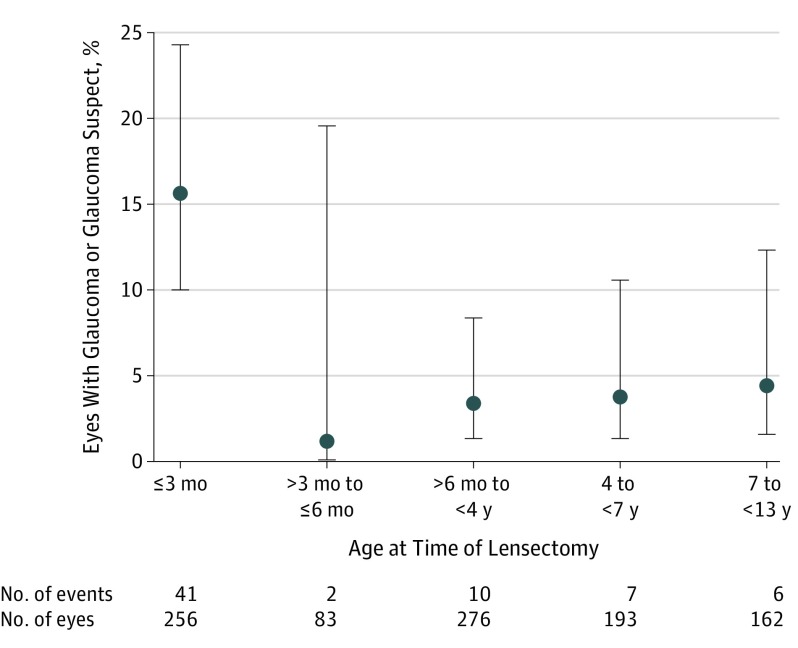
Figure. Glaucoma or Glaucoma Suspect According to Age at Time of Lensectomy.
Data markers represent the risk of developing glaucoma or glaucoma suspect for each age category, and corresponding error bars represent the 99% CI for each risk. Poisson regression, using generalized estimating equations to adjust for the correlation between eyes of participants who underwent bilateral lensectomy, was used to estimate the incidence risk and corresponding 99% CI for each age category.

