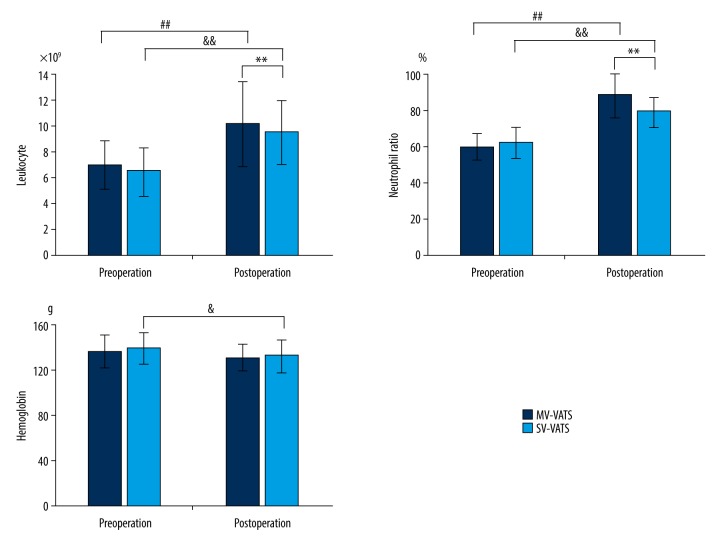
Figure 1.
Blood cells analysis change in the MV-VATS group and SV-VATS group before and after the operation. # P values present the comparison of pre-operation and post-operation in the MV-VATS group. & P values present the comparison of pre-operation and post-operation in the SV-VATS group. * P values present the postoperative comparison between the MV-VATS group and SV-VATS group.

