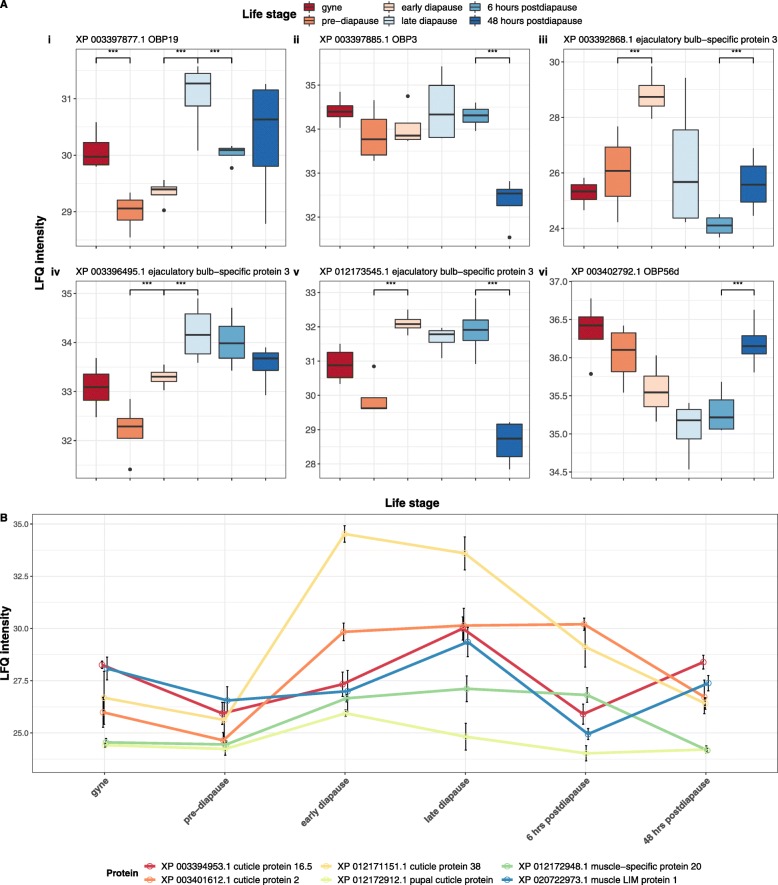
Fig. 4.
Olfaction and structural-related protein changes in queen haemolymph in response to diapause. a Box plot representations of protein abundances at six points throughout the bumblebee queen life-cycle for six olfaction-related proteins including three odorant binding proteins and three ejaculatory bulb-specific proteins. For each protein, the y-axis shows the LFQ intensity values. The x-axis represents the queen life stages. Each box is coloured to indicate a different life stage of the queen. Stages with a significant difference in abundance (p < 0.05) are indicated with astrisks. b Line plot shows relative abundance changes between structural-related proteins within the queen haemolymph at six time-points. The y-axis shows the LFQ intensity values. The x-axis represents the individual queen life stages

