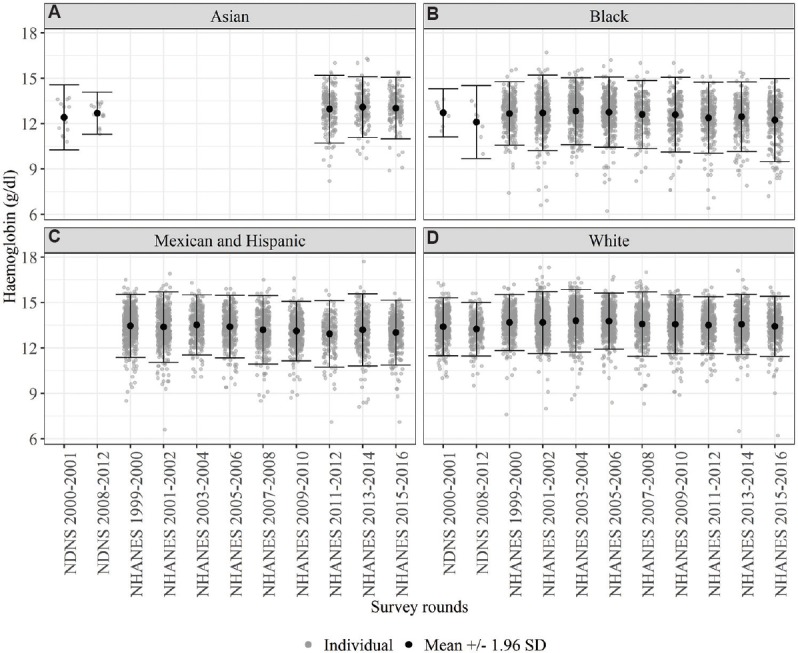
Fig. 1.

Distribution of haemoglobin across surveys by race legend: g/dl. NHANES, National Health and Nutrition Examination Survey; NDNS, National Diet and Nutrition Survey. Ranges of haemoglobin across different rounds of NHANES (9 rounds) and NDNS (2 rounds) for 4 ethinicities - (A) Asian, (B) Black, (C) Hispanic and Mexican and (D) White. The distribution of haemoglobin was consistent over time in a self-reported healthy population.
