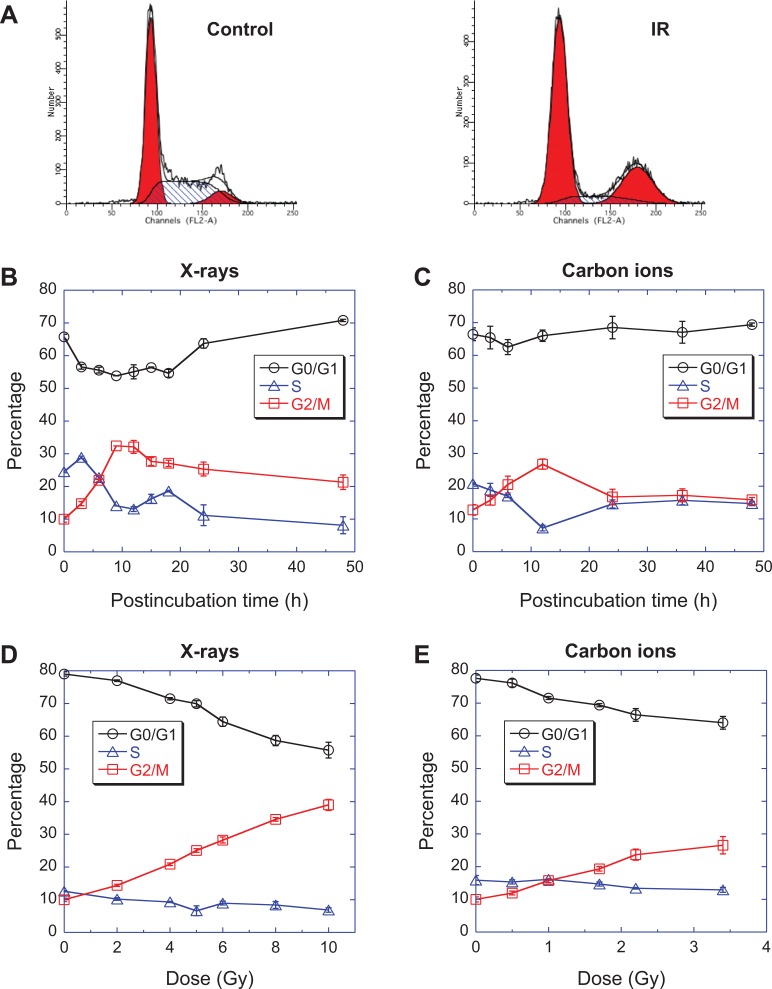
Figure 2.
Dose- and time-dependency of the cell cycle distribution of C32TG cells exposed to ionizing radiation. (A) the cell cycle distribution measured with propidium iodide staining and flow cytometry, (B) dynamics of cell cycle distribution after exposure to 5 Gy of X-rays, (C) dynamics of cell cycle distribution after exposure to 1.7 Gy of carbon ions, (D) the cell cycle distribution 48 hours after exposure to various doses of X-rays, (E) the cell cycle distribution 48 hours after exposure to various doses of carbon ions. Data are presented as the mean ± standard error. All experiments were independently repeated at least 3 times.

