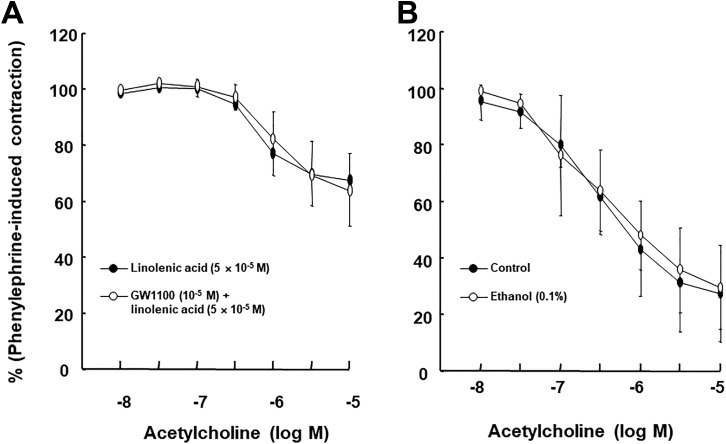
Figure 3.
A, Effect of GW1100 on the acetylcholine-induced relaxation in isolated endothelium-intact rat aortae treated with linolenic acid. Data (N = 6) are shown as the mean ± standard deviation and expressed as the percentage of maximal contraction induced by phenylephrine. N indicates the number of isolated rat aortae. B, Effect of ethanol on the acetylcholine-induced relaxation in isolated endothelium-intact rat aortae. Data (N = 8) are shown as mean ± standard deviation and expressed as the percentage of maximal contraction induced by phenylephrine. N indicates the number of isolated rat aortae.

