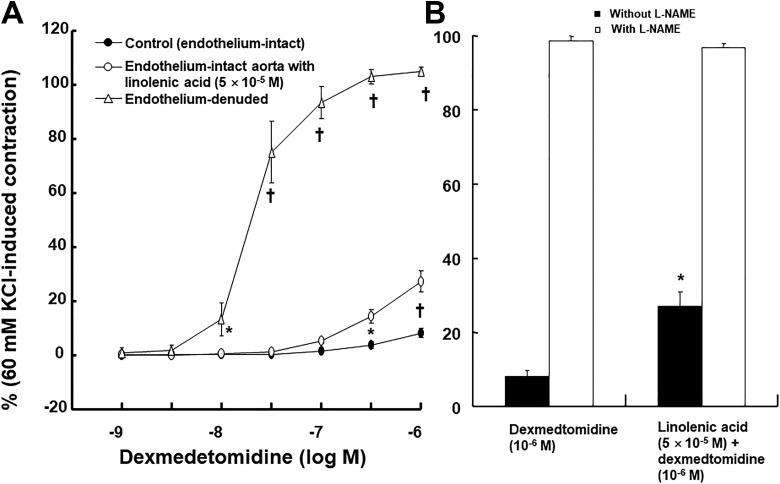
Figure 5.
Concentration–response curves induced by cumulative addition of dexmedetomidine (A), followed by Nω-nitro-l-arginine methyl ester (l-NAME, 10−4 M) (B) in endothelium-intact rat aortae with (N = 15) or without (n = 13) linolenic acid and endothelium-denuded rat aortae (N = 15). l-NAME (B) was added only to endothelium-intact rat aortae with or without linolenic acid after dexmedetomidine (10−6 M) produced maximal contraction. Data are shown as mean ± standard deviation and expressed as the percentage of maximal contraction induced by isotonic 60 mM KCl. N indicates the number of isolated rat aortae. A, *P < .01 and † P < .001 versus control. B, *P < .001 versus dexmedetomidine (10−6 M) alone.

