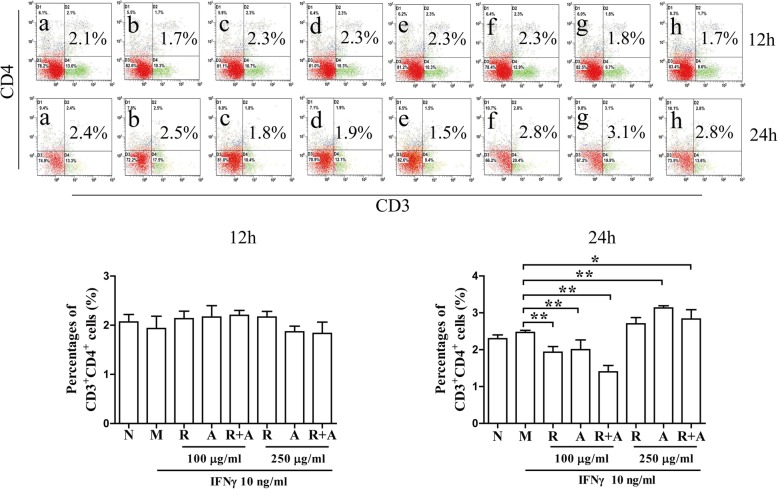
Fig. 3.
Effects on the proliferation of CD3+CD4+ T cells in BM cells after 12 and 24 h of treatment. The results are presented in bar charts. a, Normal (N) group; b, Model (M) group; c and f, Radix Astragali (R) group; d and g, Radix Angelicae Sinensis (A) group; e and h, Radix Astragali + Radix Angelicae Sinensis (R + A) group; c, d and e were treated with 100 μg/mL of freeze-dried powders, and f, g and h were treated with 250 μg/mL of freeze-dried powders. The results are presented in a bar chart. Data are presented as the mean ± SD, n = 3. *P < 0.05 and **P < 0.01

