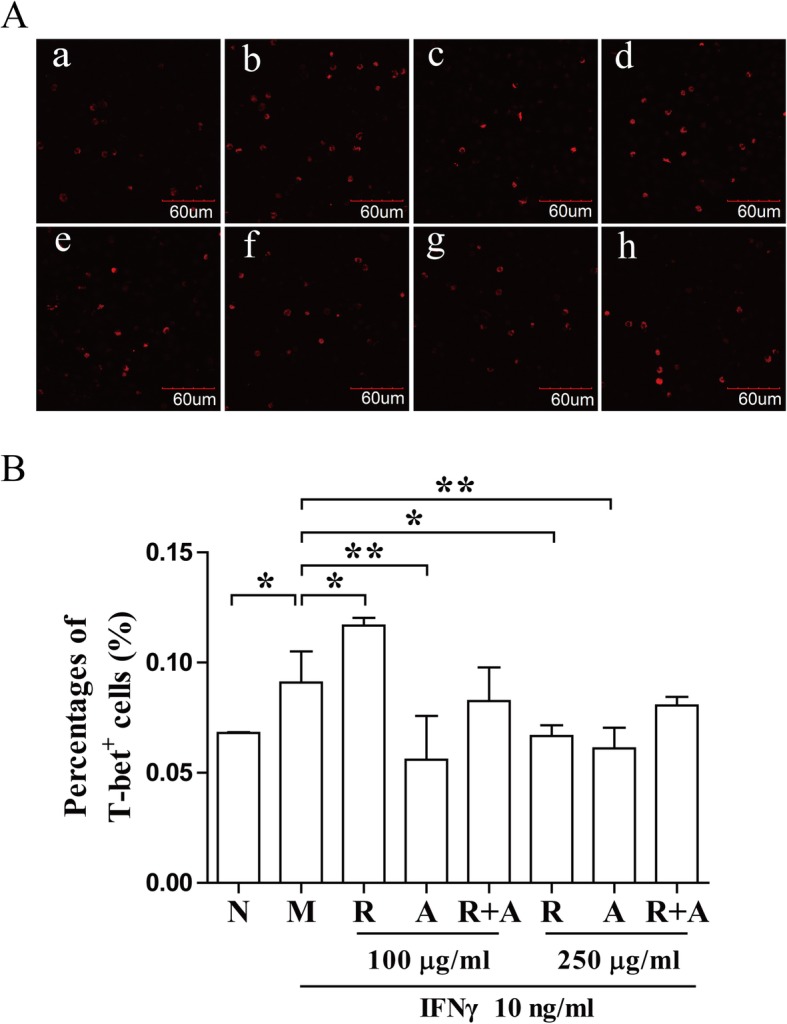
Fig. 7.

Interference in the expression and distribution of T-bet in BM cells after 12 h of treatment. (a) Staining for T-bet (red) in BM cells was observed by confocal immunofluorescence microscopy. The stained cells (red) were quantitated with ImageJ. The scale bar corresponds to 60 μm throughout. (b) The quantified results are presented in a bar chart. a, Normal (N) group; b, Model (M) group; c and f, Radix Astragali (R) group; d and g, Radix Angelicae Sinensis (A) group; e and h, Radix Astragali + Radix Angelicae Sinensis (R + A) group; c, d and e were treated with 100 μg/mL of freeze-dried powders and f, g and h were treated with 250 μg/mL of freeze-dried powders. Data are presented as the mean ± SD, n = 3. *P < 0.05 and **P < 0.01
