Fig. 4.
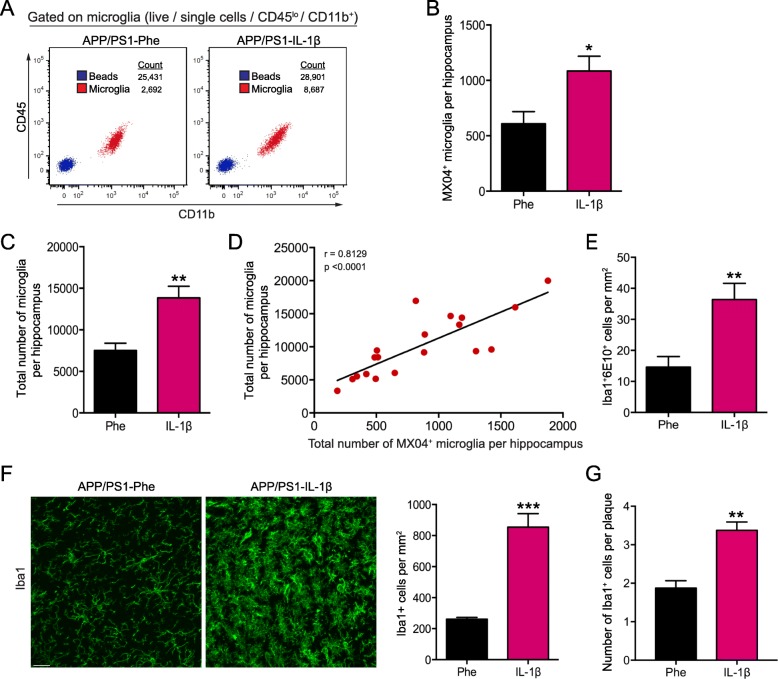
IL-1β increases the total number of microglia that correlates with the number of microglia that internalized Aβ. a Representative flow plots used for analysis of total microglia (CD45loCD11b+) cell counts in the hippocampus of APP/PS1 mice transduced with either rAAV2-Phe or rAAV2-IL-1β. A fixed volume of AccuCount beads (blue) was added to each sample in order to calculate the total number of microglia (red) in each sample as described in Methods. b Number of MX04+ microglia per hippocampus in rAAV2-Phe or rAAV2-IL-1β treated mice. c Total number of microglia per hippocampus in rAAV2-Phe or rAAV2-IL-1β treated mice. n = 10–12 per group. Data displayed as mean ± SEM, unpaired t test, *p < 0.05, **p < 0.005. d Correlation between the total number of microglia and the total number of microglia that internalized MX04+-Aβ calculated using Pearson correlation coefficient. e The number of Iba1+6E10+ cells per mm2 in APP/PS1 mice transduced with rAAV2-Phe or rAAV2-IL-1β was determined from data shown in Figure 3C. f Representative images (left) and quantification (right) of total Iba1+ microglia, and g the number of plaque-associated Iba1+ microglia in APP/PS1 mice transduced with either rAAV2-Phe or rAAV2-IL-1β. Scale bar = 20 μm. n = 5 per group. Data displayed as mean ± SEM, unpaired t test, **p < 0.01, ***p < 0.0005

