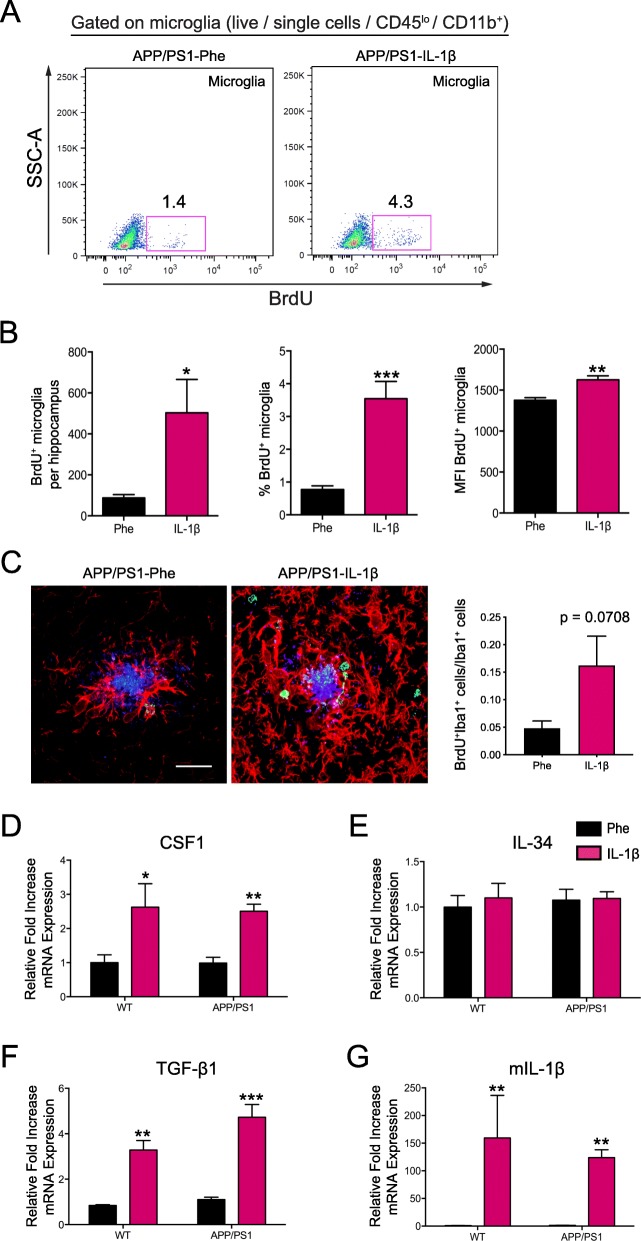
Fig. 5.
IL-1β overexpression induces proliferation of hippocampal microglia. a Representative flow plots of BrdU+ proliferating hippocampal microglia (CD45loCD11b+) in the absence and presence of IL-1β overexpression. b Quantification of the total number of BrdU+ microglia (left), percentage of BrdU+ microglia, and the mean fluorescence intensity (MFI) of BrdU expression. n = 6 per group. Data displayed as mean ± SEM, unpaired t test, *p < 0.05, **p < 0.005, ***p < 0.0005. c Representative images (left) and quantification (right) of the proportion of BrdU+ (green) plaque-associated microglia (Iba1+; red). Scale bar = 20 μm. n = 5 per group. Data displayed as mean ± SEM, unpaired t test. d–g Quantitative real-time PCR of hippocampal tissue from APP/PS1 mice and age-matched wild-type controls transduced with either rAAV2-Phe or rAAV2-IL-1β showing mRNA expression relative to control for murine Csf1r (c), Il34 (d), Tgfb1 (e), and Il1b (f). All samples were normalized to Gapdh. n = 6–12 per group. Data displayed as mean ± SEM, two-way ANOVA, *p < 0.05, **p < 0.005, ***p < 0.0005

