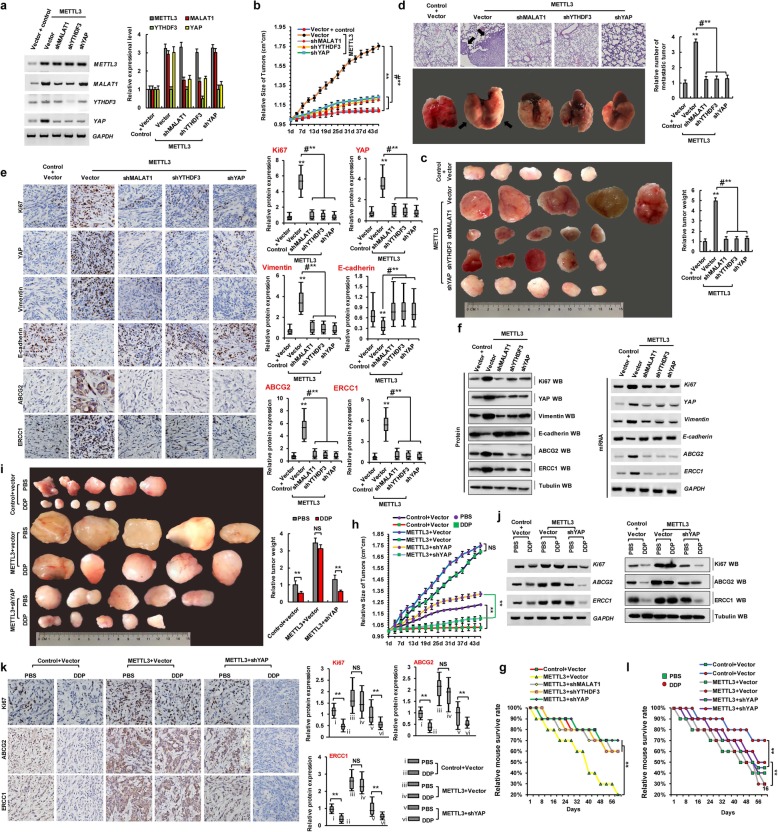
Fig. 6.
The reduction of YAP m6A modification inhibits tumor growth and enhances DDP sensitivity in vivo. a The expressions of METTL3, MALAT1, YTHDF3 and YAP were analyzed by RT-PCR (left panel) and qPCR (right panel) in the A549 cells with transfections of controlvector, METTL3Vector, METTL3shMALAT1, METTL3shYTHDF3 or METTL3shYap, respectively. b, c Xenografted A549 cell tumors with stably expressing controlvector, METTL3Vector, METTL3shMALAT1, METTL3shYTHDF3 and METTL3shYap in mice and the dimensions were measured at regular intervals. d Representative H&E-stained microscopic images of the mouse lung tumors originated from xenografted A549 cells with stably expressing controlvector, METTL3Vector, METTL3shMALAT1, METTL3shYTHDF3 and METTL3shYap by subcutaneous injection. e, f The protein expression levels of Ki67, YAP, vimentin, E-cadherin, ABCG2 and ERCC1 were analyzed by immunohistochemical staining (n = 5) (e), western blot and RT-PCR (f) in the xenografted A549 cell tumors with stably expressing controlvector, METTL3Vector, METTL3shMALAT1, METTL3shYTHDF3 and METTL3shYap of mice. g Kaplan–Meier overall survival (OS) curves of the mice with transfected of A549 cells with stably expressing controlvector, METTL3Vector, METTL3shMALAT1, METTL3shYTHDF3 and METTL3shYap. h, i Xenografted A549 cell tumors with stably expressing controlvector, METTL3 Vector and METTL3shYap were treated with PBS or DDP and the dimensions were measured at regular intervals. j, k The tumor nodules from controlvector, METTL3 Vector and METTL3shYap groups were treated with PBS or DDP every three days. The protein expression levels of Ki67, ABCG2 and ERCC1 were analyzed by western blot, RT-PCR j and immunohistochemical staining assays (n = 5) (k). l Kaplan–Meier overall survival (OS) curves of the mice that were transfected of A549 cells with stably expressing controlvector, METTL3Vector and METTL3shYAP by treatment of DDP or PBS every three days. Results were presented as mean ± SD three independent experiments. **P < 0.01 indicates a significant difference between the indicated groups. NS, not significant

