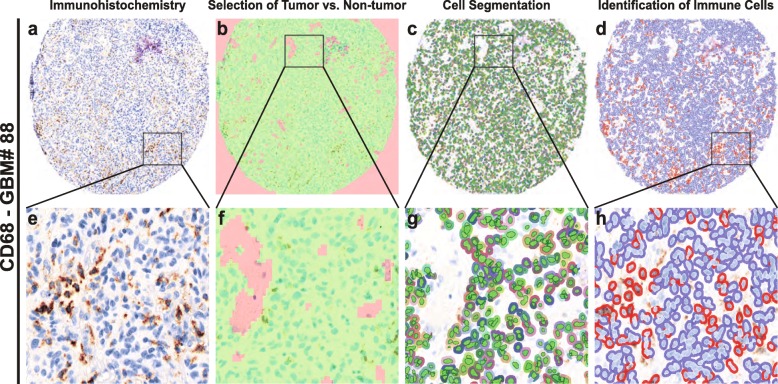
Fig. 1.
Automated cell analysis. a and e: Vectra scan multispectral image of a tissue core labeled with an immunohistochemical stain (CD68). b and f: Tissue segmentation. The image analysis software algorithm was trained to identify areas of tumor (green) and non-tumor (red), the latter of which includes areas of necrosis and vessels containing peripheral blood. c and g: Cell identification. The algorithm was trained to identify cells including tumor and infiltrating cells. Areas identified as non-tumor are not segmented. d and h: Automated binary scoring of immunohistochemical stain (blue – negative, red – positive)

