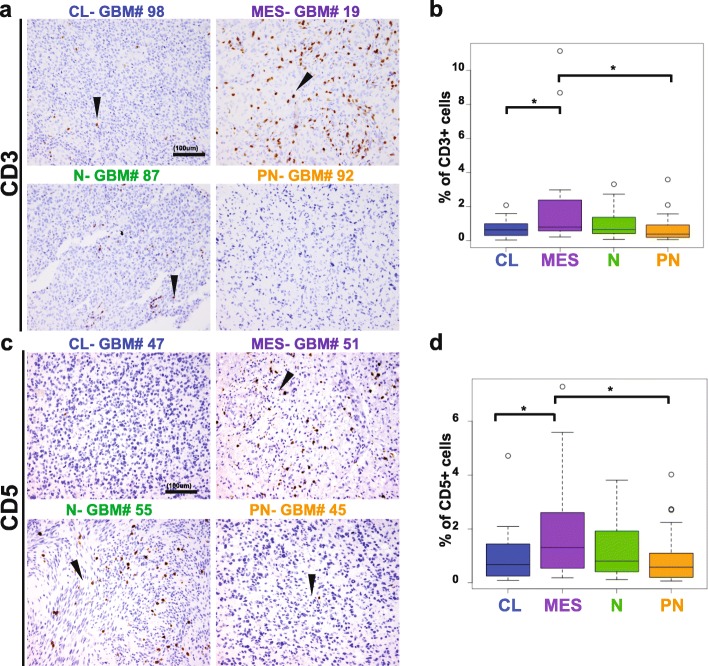
Fig. 4.
Levels of T cell infiltration differ across GBM subtypes. a, c: Representative classical, mesenchymal, neural and proneural GBM stained for CD3 and CD5 (in brown, arrows). b, d: Mesenchymal GBMs have the highest number of CD3 and CD5 positive T cells in comparison to the other molecular subtypes. Scale bar, 100 μm. Arrowheads indicate representative positive cells. CL, classical; MES, mesenchymal; N, neural; P, proneural. * p < 0.05; ** p < 0.01; *** p < 0.001; **** p < 0.0001

