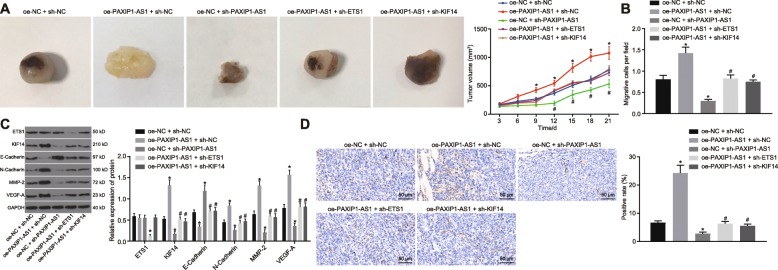
Fig. 5.
LncRNA PAXIP1-AS1/ETS1/KIF14 axis affects the development of glioma in vivo. a, The representative images and volume quantitation of xenograft tumors. b, The weight quantitation of xenograft tumor. c, Western blot analysis of expression of E-Cadherin, N-Cadherin, MMP-2, VEGF-A, ETS1 and KIF14 normalized to GAPDH in xenograft tumors. d, The expression of CD31 examined by immunohistochemistry to calculate MVD in xenograft tumors (200 ×). * p < 0.05 vs. the oe-NC + sh-NC group, # p < 0.05 vs. the oe-PAXIP1-AS1 + oe-ETS1 + sh-NC group. The values are measurement data and expressed as mean ± standard deviation. Comparisons among multiple groups were made using one-way ANOVA with Tukey’s post hoc test. Comparisons between time-based measurements were performed with repeated measures ANOVA, followed by Bonferroni post hoc test. N = 10

