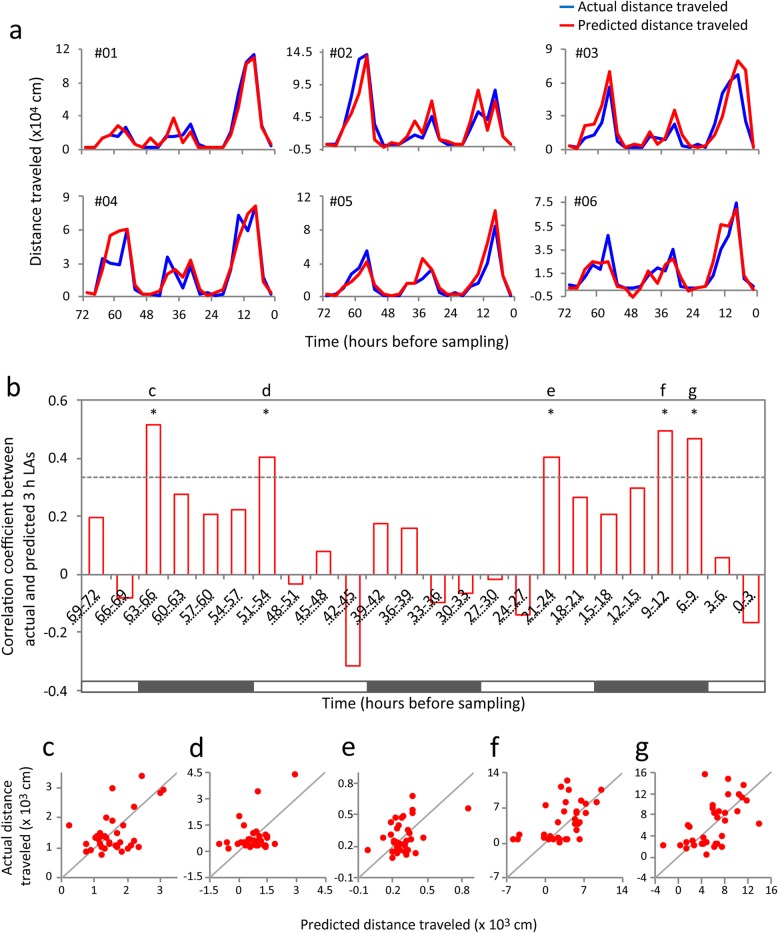
Fig. 3.
Prediction of 3 h LAs during the 3 days before sampling. a The prediction results of 6 mice are shown; the results of the remaining 29 mice are shown in Additional file 1: Figure S2. b Correlation coefficients between the actual and the predicted 3 h LAs in each time window. Dashed lines indicate P value of 0.05 and asterisks indicate significant correlations between actual and predicted 3 h LAs after FDR correction (q value < 0.1). Black and white bars indicate dark and light periods, respectively. c–g Scatter plots of predicted and actual 3 h LAs of each mouse at the time windows indicated in b. LA, locomotor activity

