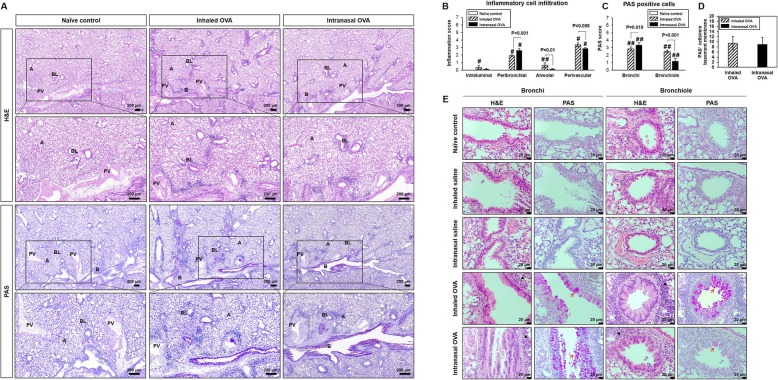
Fig. 5.
Infiltration of inflammatory cells and mucus secretion in lung tissue from control and OVA-sensitized and challenged mice. Representative H&E- and PAS-stained sections of lung and higher magnifications (a). Histological scoring of inflammatory cell infiltration (b) and goblet cells (c). Number of PAS+ cells were counted and normalized by area of basement membrane (d). Representative H&E- and PAS-stained sections in bronchi and bronchiole (e). Black and red arrows indicate inflammatory cells and goblet cells. B; bronchi, BL; bronchiole, A; alveolar, PV; perivascular. Bars represent the mean ± SD from five mice per group. #p < 0.05 vs. naïve control

