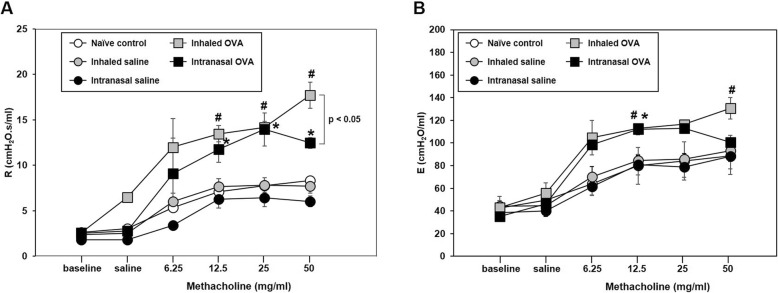
Fig. 7.
Changes in airway responsiveness according to methacholine concentration in control and OVA-sensitized and challenged mice. a Respiratory system resistance (Rrs) and (b) elastance (E) was measured 24 h after the last OVA challenge in mice. Bars represent the mean ± SEM (n = 5/group). #p < 0.05 vs. inhaled saline, *p < 0.05 vs. intranasal saline

