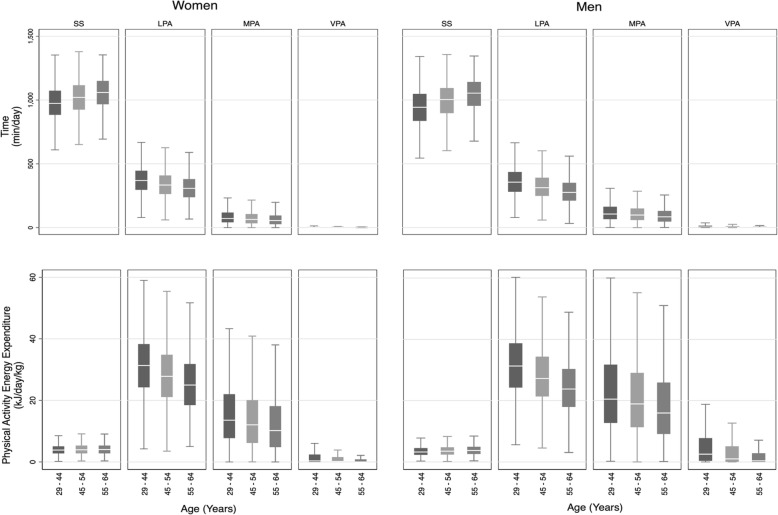
Fig. 2.
Sex stratified intensities of physical activity by time (minutes per day) and energy expenditure (kJ/day/kg) in the Fenland cohort. SS = sedentary or sleep (< 1.5 METs); LPA = light physical activity (1.5-3METs); MPA = moderate physical activity (3-6METs); VPA = vigorous physical activity (>6METs) Box plots represent medians and interquartile ranges.

