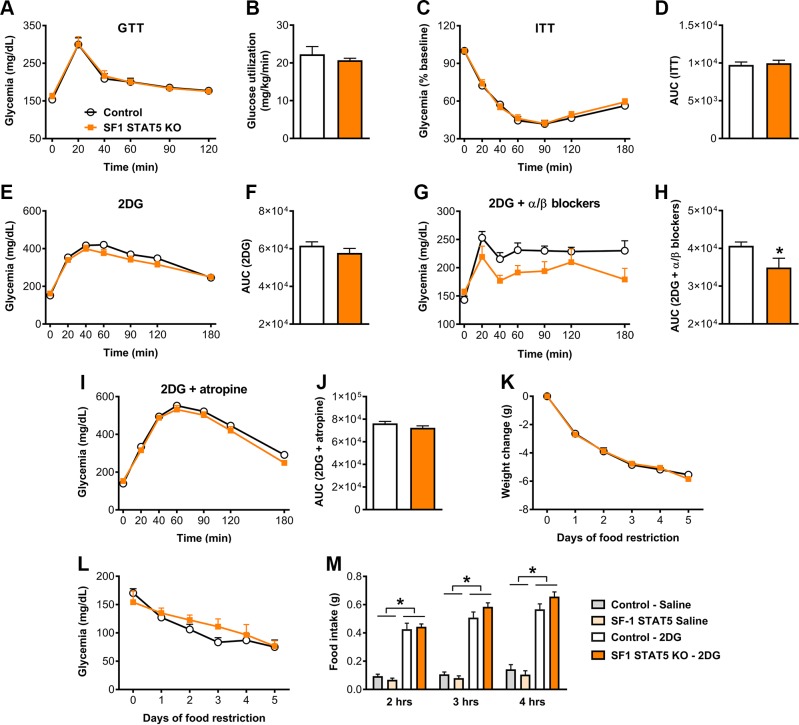
Figure 10.
STAT5 ablation in SF1 cells attenuates the CRR induced by 2DG infusion. A) Blood glucose levels during a GTT (n = 12). B) Glucose utilization during a hyperinsulinemic-euglycemic clamp (P = 0.4274; n = 3–4). C) Blood glucose levels during an ITT (n = 18–22). D) AUC of the ITT (P = 0.6876). E) Blood glucose levels during a CRR induced by 2DG infusion (n = 19–21). F) AUC of the 2DG test (P = 0.2256). G) Blood glucose levels after coinfusion of 2DG and α(phentolamine)/β (propranolol) blockers (n = 7–11). H) AUC after coinfusion of 2DG and α/β blockers (P = 0.0240). I) Blood glucose levels after coinfusion of 2DG and atropine (n = 5–11). J) AUC after coinfusion of 2DG and atropine (P = 0.2057). K, L) Daily changes in body weight {interaction between food restriction effect and STAT5 ablation [F(5, 85) = 0.8211, P = 0.5381]; n = 8–11} and glycemia {interaction between food restriction effect and STAT5 ablation [F(5, 85) = 1.309, P = 0.2678]; n = 8–11} in mice that received 40% of their normal intake 2 h before lights off for 5 consecutive days. M) Food intake after intraperitoneal injection of either saline or 2DG in control and SF1 STAT5 KO mice. Values are means ± sem. *P < 0.05.

