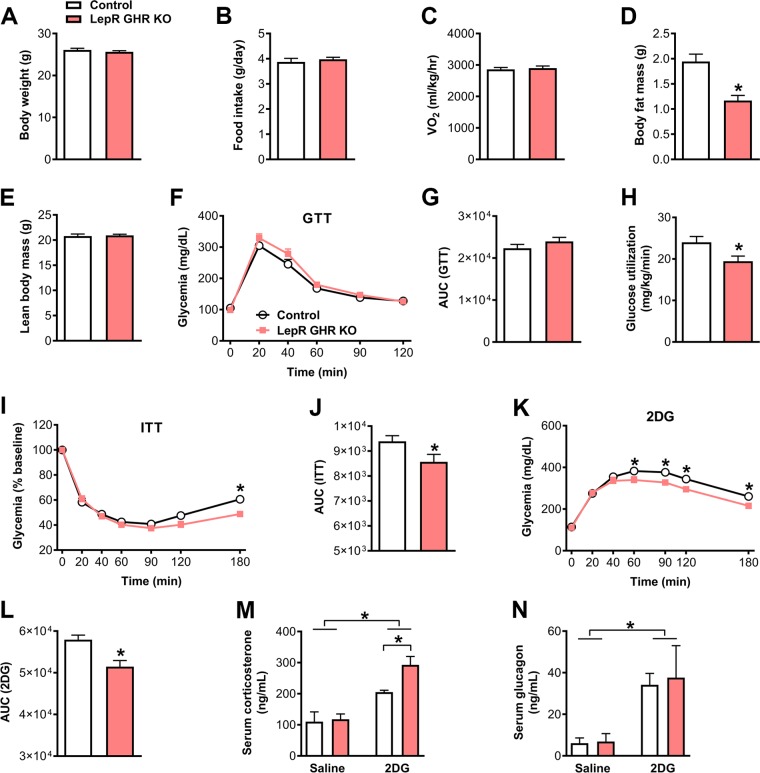
Figure 2.
Glucose homeostasis and CRR in control and LepR GHR KO mice. A) Body weight of control and LepR GHR KO mice (n = 10–13). B) Daily food intake (n = 12–20). C) Oxygen consumption (n = 7–11). D) Body fat mass (n = 10–13; P = 0.0002). E) Lean body mass (n = 10–13). F) Blood glucose levels during a GTT (n = 12–18). G) AUC of the GTT (P = 0.2715). H) Glucose utilization during a hyperinsulinemic-euglycemic clamp (P = 0.0264; n = 8–10). I) Blood glucose levels during an ITT (n = 18–25). J) AUC of the ITT (P = 0.0487). K) Blood glucose levels during a CRR induced by 2DG infusion (n = 21–26). L) AUC of the 2DG test (P = 0.0015). M) Serum corticosterone levels {interaction between 2DG effect and GHR ablation [F(1, 13) = 3.476, P = 0.085]; n = 3–5}. N) Serum glucagon levels {interaction between 2DG effect and GHR ablation [F(1, 23) = 0.0357, P = 0.8518]; n = 5–11}. Values are means ± sem. *P < 0.05.

