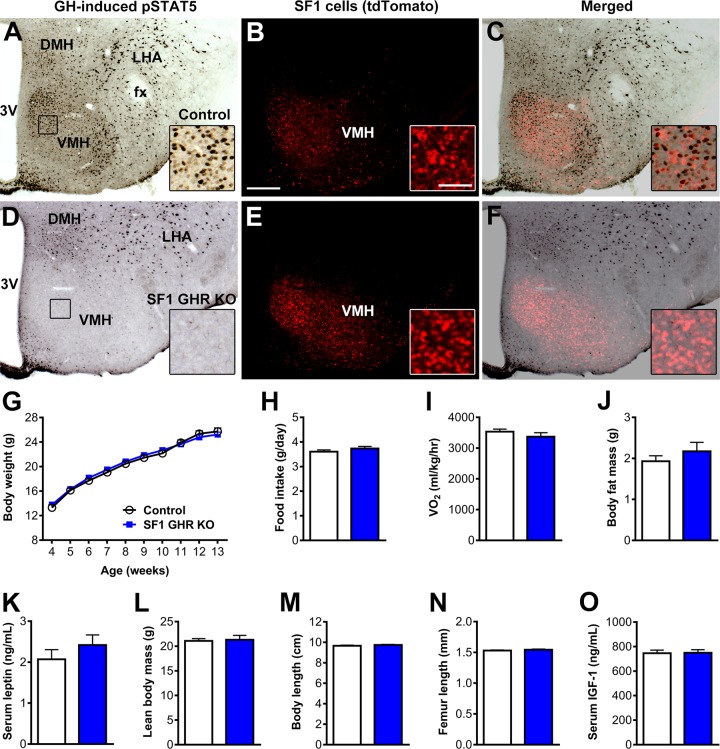
Figure 3.
GHR ablation in SF1 cells causes no changes in energy homeostasis. A–F) Photomicrographs showing SF1 cells (red) and pSTAT5 (black) 90 min after an intraperitoneal injection of porcine GH (20 µg/g) in SF1-Cre::LSL-tdTomato mice (control) and SF1 GHR KO::LSL-tdTomato mice. The insets represent higher magnification photomicrographs of the selected areas. 3V, third ventricle; DMH, dorsomedial nucleus; fx, fornix; LHA, lateral hypothalamic area. Scale bars, 200 and 50 µm (insets). G) Body weight of control and SF1 GHR KO mice (n = 5–31). H) Daily food intake (n = 21–28). I) Oxygen consumption (n = 4). J) Body fat mass (n = 5–11). K) Serum leptin levels (n = 9–11). L) Lean body mass (n = 5–11). M) Body length (n = 8–13). N) Femur length (n = 10–12). O) Serum IGF-1 levels (n = 9–10). Values are means ± sem.

