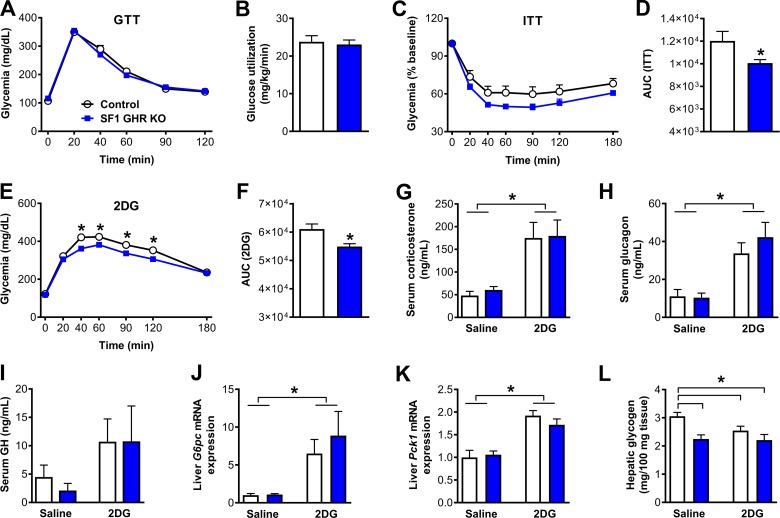
Figure 4.
GHR ablation in SF1 cells impairs the CRR to hypoglycemia. A) Blood glucose levels during a GTT (n = 17–24). B) Glucose utilization during the hyperinsulinemic-euglycemic clamp (P = 0.7356; n = 7–8). C) Blood glucose levels during an ITT (n = 21–28). D) AUC of the ITT (P = 0.0193). E) Blood glucose levels during a CRR induced by 2DG infusion (n = 17–27). F) AUC of the 2DG test (P = 0.0024). G) Serum corticosterone levels {interaction between 2DG effect and GHR ablation [F(1, 21) = 0.0183, P = 0.8936]; n = 6–7}. H) Serum glucagon levels {interaction between 2DG effect and GHR ablation [F(1, 23) = 0.6025, P = 0.4455]; n = 5–9}. I) Serum GH levels {interaction between 2DG effect and GHR ablation [F(1, 12) = 0.0928, P = 0.7658]; n = 4}. J) Hepatic G6pc mRNA levels (interaction between 2DG effect and GHR ablation [F(1, 18) = 0.6377, P = 0.4349]; n = 4–7). K) Hepatic Pck1 mRNA levels {interaction between 2DG effect and GHR ablation [F(1, 19) = 1.151, P = 0.2968]; n = 5–7}. L) Hepatic glycogen content {GHR ablation effect [F(1, 20) = 12.22, P = 0.0023]; interacion between 2DG effect and GHR ablation [F(1, 20) = 2.078, P = 0.1649]; n = 6}. Values are means ± sem. *P < 0.05.

