Figure 7.

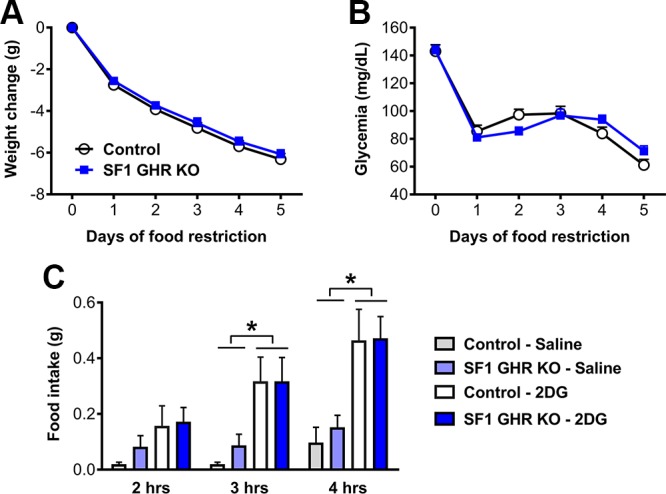
Changes in body weight and glycemia during food restriction, and glucoprivic-induced hyperphagia in control and SF1 GHR KO mice. A, B) Daily changes in body weight {interaction between food restriction effect and GHR ablation [F(5, 235) = 0.3783, P = 0.8633]; n = 21–28} and glycemia {interaction between food restriction effect and GHR ablation [F(5, 210) = 2.515, P = 0.0309]; n = 19–25} in mice that received 40% of their normal intake 2 h before lights off for 5 consecutive days. C) Food intake 2 h {main effect of 2DG [F(1, 12) = 4.651, P = 0.052], main effect of GHR ablation [F(1, 12) = 0.5398, P = 0.4766], and interaction [F(1, 12) = 0.2028, P = 0.6605]; n = 4}, 3 h {main effect of 2DG [F(1, 12) = 14.83, P = 0.0023], main effect of GHR ablation [F(1, 12) = 0.2429, P = 0.631], and interaction [F(1, 12) = 0.2429, P = 0.631]}, and 4 h {main effect of 2DG [F(1, 12) = 18.22, P = 0.0011], main effect of GHR ablation [F(1, 12) = 0.1506, P = 0.7047], and interaction [F(1, 12) = 0.087, P = 0.7731]} after intraperitoneal injection of either saline or 2DG in control and SF1 GHR KO mice. Values are means ± sem. *P < 0.05 (Bonferroni’s multiple comparisons test).
