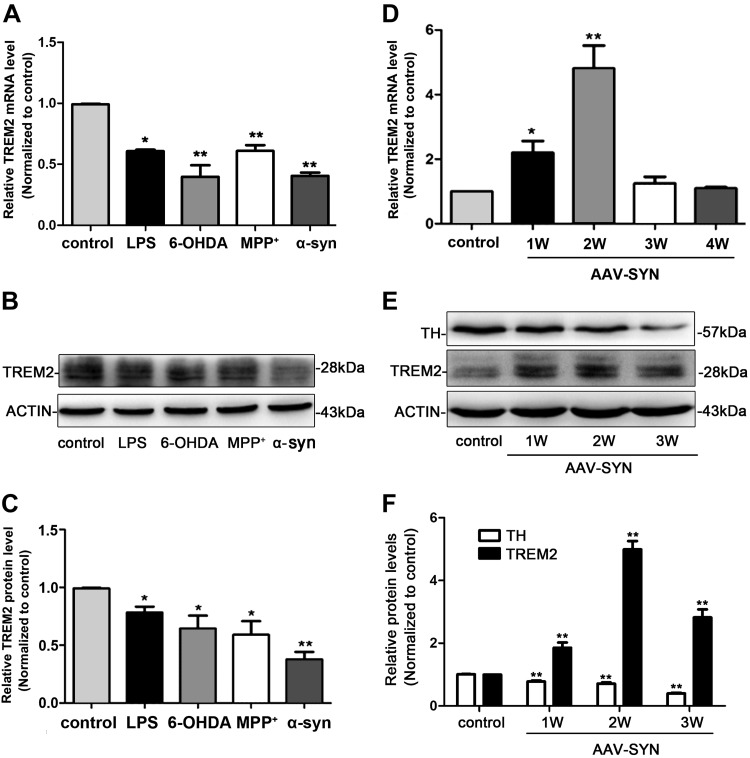
Figure 1.
The expression pattern of TREM2 in BV2 microglial cells and AAV-SYN–induced PD mice models. A) BV2 microglial cells were exposed to LPS (100 ng/ml), MPP+ (50 μM), 6-OHDA (75 μM), and α-syn (500 nM) for 24 h; the mRNA level of TREM2 was analyzed with real-time RT-PCR. B, C) Representative immunoblot documents and summarized data showing the protein level of TREM2 in BV2 microglial cells after being exposed to LPS (100 ng/ml), MPP+ (50 μM), 6-OHDA (75 μM), and α-syn (500 nM) for 24 h. D) Real-time RT-PCR analysis of TREM2 mRNA level in the SN at different time points after AAV-SYN injection in mice. E, F) Representative immunoblot documents and summarized data showing the protein levels of TREM2 and TH in the striatum at different time points after AVV-SYN injection in mice. All data are presented as the mean ± sem of triplicate independent experiments. *P < 0.05, **P < 0.01 vs. control.

