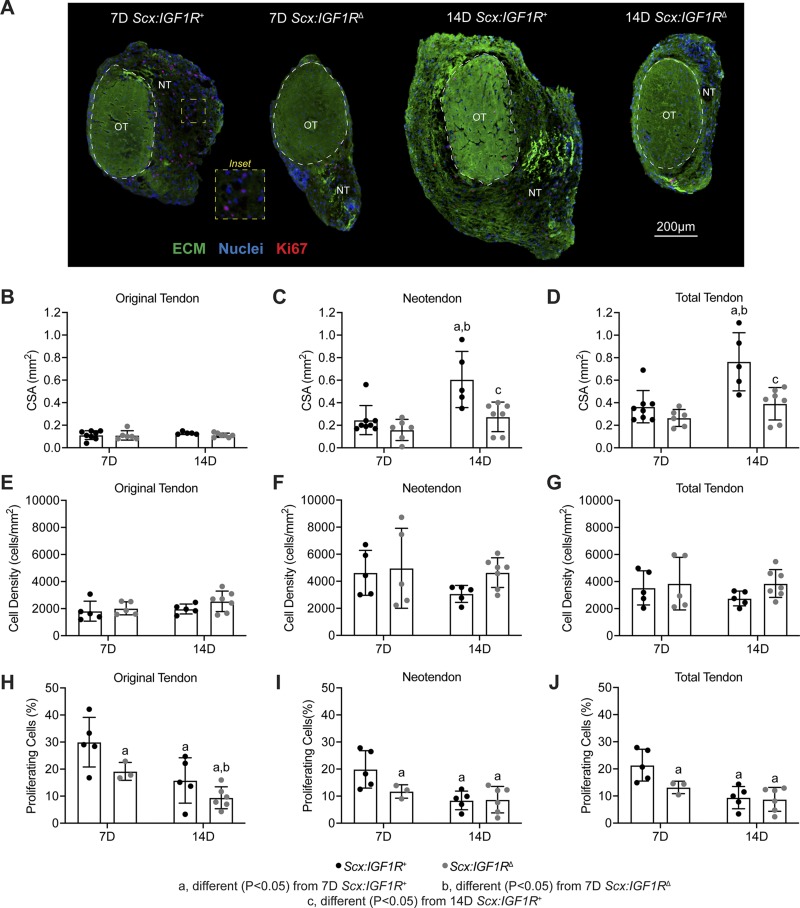
Figure 2.
Effect of IGF1R deletion on tendon growth and cell proliferation. A) Representative histology of cross-sections from Scx:IGF1R+ and Scx:IGF1RΔ mice obtained at either 7 or 14 d after mechanical overload demonstrating general morphology, cell density, and abundance of proliferating cells. The original tendon (OT) and neotendon (NT) are indicated by the hashed line. ECM, green; nuclei, blue; Ki67 (proliferating cells), red. Scale bar for all sections is 200 µm. B–D) Area measurements of tendons, with respect to the original tendon (B), neotendon (C), and total tendon (D). E–G) Cell density measurements of tendons, with respect to the original tendon (E), neotendon (F), and total tendon (G). H–J) Cell proliferation measurements, with respect to the original tendon (H), neotendon (I), and total tendon (J). Values are means ± sd, with individual data points presented. Differences tested with a 2-way ANOVA: significantly different (P < 0.05) from 7D Scx:IGF1R+ mice (a); significantly different (P < 0.05) from 7D Scx:IGF1RΔ mice (b); and significantly different (P < 0.05) from 14D Scx:IGF1R+ mice (c); n ≥ 3 mice/group. 7D, 7 d; 14D 14 d.

