Figure 4.
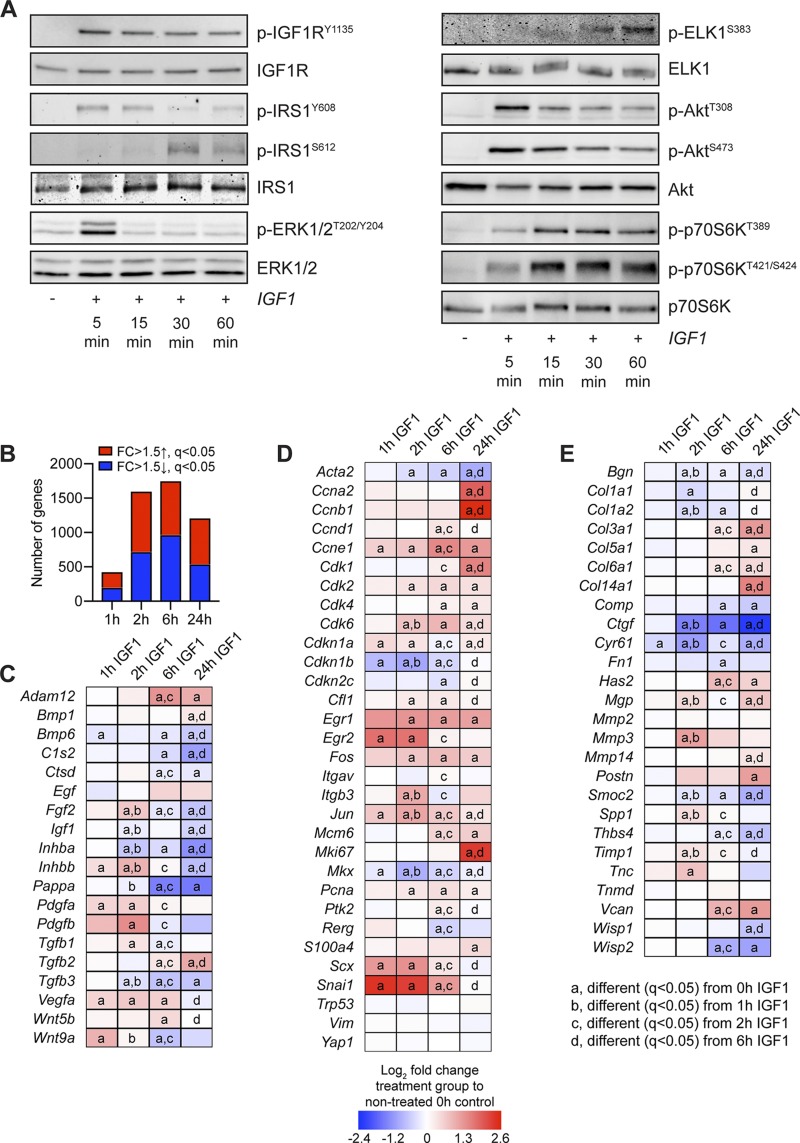
Signaling protein activation and RNAseq in cultured tenocytes treated with IGF1. A) Representative Western blots for p-IGF1RY1135, total IGF1R, IRS1Y608, IRS1S612, total IRS1, p-ERK1/2T202/Y204, total ERK1/2, p-ELKS383, total ELK, p-AktT308, p-AktS473, total Akt, p-p70S6KT389, p-p70S6KT421/S424, and total p70S6K in cultured tenocytes that were untreated (0 min) or treated with IGF1 for 5, 15, 30, or 60 min. B–E) RNAseq analysis of untreated tenocytes (0 h) or tenocytes treated with IGF1 for 1, 2, 6, or 24 h. The fold change (FC) value displayed for each group is relative to tenocytes that were not treated with IGF1 (0 h). B) Number of genes that were significantly up-regulated (red) with a >1.5-fold up-regulation and q < 0.05, and significantly down-regulated (blue) with a >1.5-fold up-regulation and q < 0.05. C–E) Heat maps demonstrating the log2 fold change in selected genes from RNAseq that are growth factors, cytokines, or genes involved with activating extracellular ligands (C); involved in cell proliferation and tenocyte specification and differentiation (D); or components or regulators of the ECM (E). Differences between groups tested using edgeR: different (q < 0.05) from 0 h IGF1 (a); different (q < 0.05) from 1 h IGF1 (b); different (q < 0.05) from 2 h IGF1 (c); and different (q < 0.05) from 6 h IGF1 (d).

