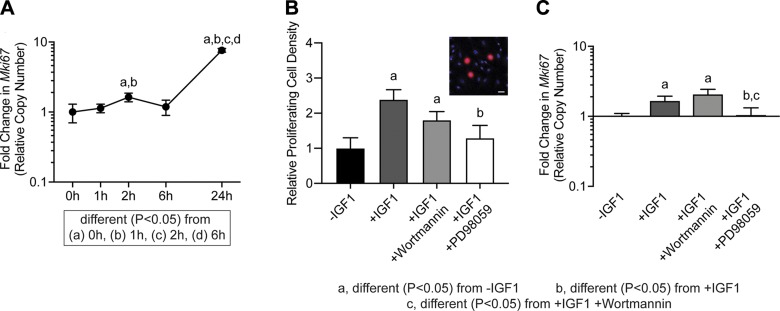
Figure 5.
Proliferation in tenocytes treated with IGF1. A) Mki67 expression in untreated tenocytes (0 h) or in tenocytes treated with IGF1 for 1, 2, 6, or 24 h, measured with qPCR. Differences between groups tested using a 1-way ANOVA: different (P < 0.05) from 0 h (a); different (P < 0.05) from 1 h (b); different (P < 0.05) from 2 h (c); and different (P < 0.05) from 6 h (d). B) The abundance of proliferating tenocytes (expressed as a percentage of total tenocytes) and Mki67 expression (C) in untreated cells or in cells treated with IGF1, IGF1 and wortmannin, or IGF1 and PD98059 for 2 h. Inset (B) is a representative image demonstrating BrdU+ nuclei (red) and total nuclei (blue). Scale bar, 30 µm. Differences tested with a 1-way ANOVA: significantly different (P < 0.05) from control (a); significantly different (P < 0.05) from IGF1 (b); and significantly different (P < 0.05) from IGF1 and wortmannin (c). Values are means ± CV; n ≥ 4 replicates/group.

