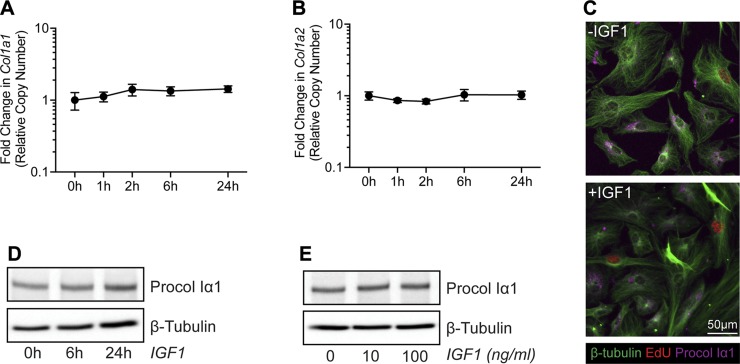
Figure 6.
Type I collagen production in tenocytes treated with IGF1. Col1a1 (A) and Col1a2 (B) expression in untreated tenocytes (0 h) or in tenocytes treated with IGF1 for 1, 2, 6, or 24 h, measured with qPCR. Values are means ± CV. Differences between groups tested using a 1-way ANOVA found no significant differences. C) Representative immunocytochemistry of cultured tenocytes treated with 0 or 100 ng/ml of IGF1 for 24 h. β-tubulin, green; EdU, red; Procol Iα1, magenta. Scale bar, 50 µm in all images. D) Representative Western blot for procollagen type Iα1 (Procol Iα1) in untreated tenocytes (0 h) or tenocytes treated with 100 ng/ml of IGF1 for 6 or 24 h. E) Representative Western blot for Procol Iα1 in tenocytes treated with 0, 10, or 100 ng/ml of IGF1 for 24 h.

